
Trading and long-term investing are complicated processes for beginners. The cryptocurrency market in 2021 has high volatility (variability of coin rates). Therefore, beginners need to learn how to assess the prospects of growth or decline in the price of жетони and coins. Fundamental analysis of cryptocurrencies (FA) is an effective forecasting method. It allows you to determine whether the rate of the selected assets will grow.
What is the fundamental analysis of cryptocurrencies
The essence of FA is to assess the real price and growth prospects of the asset by economic and financial indicators. The investor’s goal is to understand whether it is possible to buy cryptocurrency now. For this purpose, the following are studied:
- The methods of utilization of the crypto-asset.
- The number of users of the blockchain network.
- The project’s development team.
- Technical indicators (hash rate, number of transactions).
- The economic situation in the world.
- The interest of users in cryptocurrencies.
Also of great importance for analysis is the news background. Almost every headline in the media can affect the market rate of cryptocurrency. The analyst needs to take into account the news and economic forecasts.
Особливості
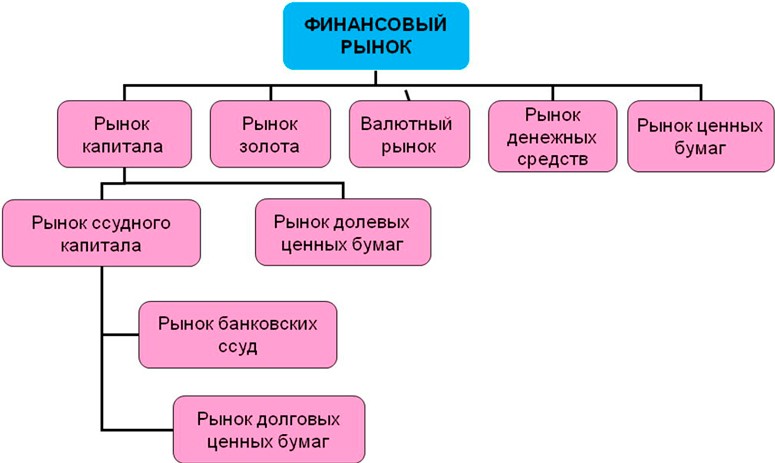
FA in cryptocurrency can be compared with similar methods of researching other financial markets. Therefore, this type of analysis is also applicable to traditional assets. However, their volatility is lower than that of koins and tokens. In addition, the evaluation of securities, bonds, commodities, fiat currencies does not take into account technical details related to the processes in the blockchain.
On the other hand, traditional assets are highly dependent on economic processes – trade, production, money issuance.
5020 $
бонус для нових користувачів!
ByBit забезпечує зручні та безпечні умови для торгівлі криптовалютою, пропонує низькі комісії, високий рівень ліквідності та сучасні інструменти для аналізу ринку. Він підтримує спотову торгівлю та торгівлю з використанням кредитного плеча, а також допомагає початківцям та професійним трейдерам за допомогою інтуїтивно зрозумілого інтерфейсу та навчальних посібників.
Заробіть 100 бонусів $
для нових користувачів!
Найбільша криптобіржа, де можна швидко та безпечно розпочати свою подорож у світі криптовалют. Платформа пропонує сотні популярних активів, низькі комісії та передові інструменти для торгівлі та інвестування. Проста реєстрація, висока швидкість транзакцій та надійний захист коштів роблять Binance чудовим вибором для трейдерів будь-якого рівня!
Challenges
The price of crypto-assets cannot be predicted by the indicators of traditional financial markets alone. The value of tokens and coins can be influenced by:
- Financial policies in the US, Japan, China and other countries.
- The growth rate of the global economy.
- Demand for raw materials.
- The cost of producing commodities and other factors.
However, for digital coins, indicators from traditional markets still provide little information for an accurate prediction. An analyst needs special metrics that are applicable only to crypto assets.
The key is to find reliable fundamental indicators. The data used in FA should be reliable and objective. For example, the number of followers in social networks or other communities is not a reliable indicator. After all, it can simply be increased artificially.
Analysts’ opinions and developers’ statements can also be biased. Statistical indicators (trading volume, number of cryptocurrency wallets created, laws passed) are much more valuable.
There is no single fundamental metric that gives a complete picture of the network. For example, an analyst may consider the rapid growth in the number of active wallets on the blockchain. However, their number is increased by a few users who simply create new addresses for each transaction. Individually, this indicator provides little useful information. To make predictions, you need to consider all the factors affecting the exchange rate of a token or koin.
Fundamental Analysis Metrics
For FA, investors use 3 key categories of metrics:
- Onchain metrics.
- Projected metrics.
- Financial metrics.
Onchain metrics
Cryptocurrency systems are transparent. People have access to all the information of the network:
- Daily active addresses.
- Number of large transactions.
- Number of existing wallets.
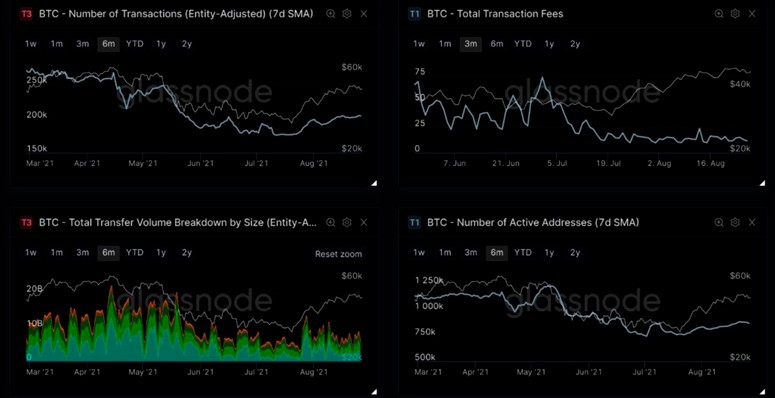
- The number of transactions per day.
- Trading fees and other system fundamentals.
You can view onchain metrics on blockchain monitoring services. They use various APIs (software tools to connect to cryptocurrency systems and exchanges) and other resources to obtain data from the digital network.
Number of transactions
An increasing number of transfers between wallet addresses in the blockchain usually indicates the growing popularity of a cryptoasset. However, separately, this fundamental indicator provides little useful information to the analyst. In new projects, only a few users can conduct a large number of transactions if they need to.
You can see the number of transactions through special sites for monitoring cryptocurrency networks like blockchain.com.
Transaction amount
The blockchain has information about every transfer between wallet addresses. Using APIs, monitoring sites collect data on the total amount of transactions per period. A rapid increase in this figure indicates an increase in interest in the koin or token.
Investors are starting to use the cryptocurrency more for digital transfers. Such a fundamental indicator suggests a possible imminent rise in the value of the crypto asset.
Active addresses
A popular fundamental indicator is also the number of active wallets for the selected period. The growth of their number indicates an increase in demand for a coin or token. Analysts count active addresses through monitoring services in 2 ways:
- The cumulative number of unique cryptocurrency wallets for the entire time.
- The total number of senders and receivers of each transaction for the specified period.
Traders more often use the first method – analyze the number of unique addresses for the whole time. Blockchain monitoring sites allow you to view this information.
Commissions
The size of this indicator of the fundamental analysis of cryptocurrency reflects the demand for transfers within the system. The commission for payment transactions grows as the network becomes busier. When this indicator is high, it indicates the active use of the digital asset by investors and traders.
It is important to take into account that the size of the commission does not directly affect the market rate. This indicator is more of a confirmation of the preconditions for growth, because the workload of the blockchain can be caused by an increase in the number of small payments that need to be processed by thenodes (nodes) of the cryptocurrency system.
Increased fees can lead to a decrease in the market rate of the asset. For example, in the Ethereum network, users paid less than $0.1 per transaction until December 2017. Thereafter, the average fee increased to $11.
Ethereum developers partially solved the problem by switching to a new algorithm. Had this not happened, many users would have abandoned the Etherium network in favor of blockchains with lower fees. This may have lowered the капіталізація and exchange rate of ETH coins.
Computational power and staking amount
Consensus algorithms are methods of reaching a common point of view of the network nodes in a blockchain. Cryptocurrency systems need such mechanisms to run continuously without errors. When a node contributes a new transaction or block to the chain, the other nodes synchronize their own copies with the updated network.
Most cryptocurrency projects are based on Доказ роботи (PoW) or Proof-of-Stake (PoS) methods. These mechanisms are very different from each other. However, both algorithms fulfill the main tasks – protecting the cryptocurrency network and maintaining its functionality.
Systems with PoW work thanks to miners – nodes that use the computing power of computer equipment. It is needed to solve cryptographic tasks.
The response is a valid (valid) хеш, that is, an identifier that contains information about the new link of the chain or transaction, it is added to the network.
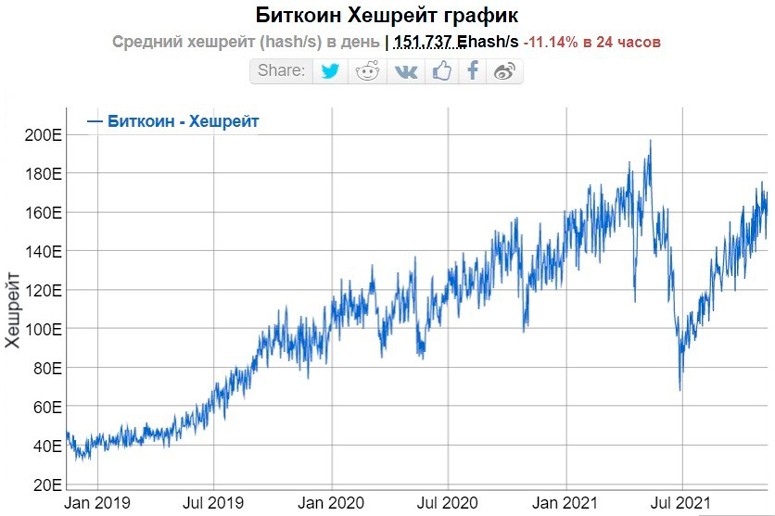
With the Proof-of-Work consensus mechanism, the main fundamental metric of a cryptocurrency system is hashrate (the total amount of computing power of all nodes in the blockchain). A large increase in this metric indicates an increase in interest in mining the coin, which can affect its price.
Systems with PoS work thanks to валідатори – nodes that block coins in the blockchain to validate their own credentials. This is called steaking. Such nodes perform validation – checking the validity of ongoing transactions. But this does not require significant computing power.
For steaking, the number of coins frozen on a special wallet is of greater importance. The size of this parameter determines the number of transactions processed by one node.
For the fundamental analysis of cryptocurrency in a blockchain with a Proof-of-Stake algorithm, the indicator of the total number of staked assets by all nodes of the system is important. An increase in their number also indicates an increase in demand for validation of digital currency.
Project Metrics
Only current onchain metrics cannot be taken into account in FA. It is required to analyze the full business model of a cryptocurrency startup. Project metrics speak about the plans and approach of the developers. The following fundamental metrics are important for analyzing a cryptocurrency project:
- Whitepaper (technical documentation).
- The team and capabilities of the developers.
- The competitiveness of the cryptocurrency project.
- Tokenomics and initial distribution of digital assets.
Whitepaper
Whitepaper is the technical documentation of the project (actually its overview). Whitepaper means a lot for fundamental analysis of the business model. It specifies important project metrics:
- Availability of the program code (whether it is open to developers).
- Methods of using the new coin in the blockchain system.
- A roadmap (roadmap) with planned major updates and smaller improvements to the cryptocurrency network.
- Scheme for altcoin marketing and digital asset distribution.
After familiarizing yourself with the whitepaper, it will be useful to read other analysts’ opinions about the digital project. It is important to determine the attitude (positive or negative) of potential investors towards the asset to increase the accuracy of price prediction.
Team
The analyst should consider the cryptocurrency project from the perspective of the realization of ambitious ideas. The team of creators should necessarily consist of specialists who are able to realize the development plan of the digital currency. An important indicator of the team is a good background – the presence of successful cases (cryptocurrency projects) in the past.
Additionally, developers can be evaluated by their community on GitHub (the largest platform for joint IT projects and open source code publication) or another service. The project’s social networks, in particular Facebook and Telegram accounts, should also be analyzed. A large number of subscribers and high user activity (likes, comments, reposts, discussions) indicate the possible success of the developers in the future.

Competitors
A good detailed whitepaper gives an investor a broad idea of the direction of a digital project. An analyst needs to use this information to find the main competitors in the market of the cryptocurrency asset under study.
Having gathered a list of similar companies, a comparison of their metrics is required. Mainly, the investor should assess the ambition of each project’s plans and the real possibilities of their realization – whether the development team is capable of doing it.
Tokenomics and initial allocation
Traditional financial markets are subject to inflationary processes. National currencies depreciate due to the rapid issuance of large amounts of money. Crypto-assets, on the other hand, cannot be subject to inflation because of pre-designed tokenomics. The term refers to the pattern of the following processes:
- Issuance (emission) of new coins.
- Distribution of coins among the participants of the digital network.
- Limiting the total possible amount of cryptocurrency assets.
- Burning of virtual money (destruction of a part of koins to artificially increase their market price) and other processes that are related to their use.
For fundamental analysis of a cryptocurrency, it is important for an investor to know its tokenomics. Evaluating the methods and processes of using the digital asset will allow the trader to determine the prospects for growth or decline in price.
Token is the accounting unit of investor’s investment in the ICO of a cryptocurrency project at the development stage. Also under this term are digital assets that work in other people’s blockchains. But in the context of fundamental analysis, tokenomics is also used in relation to koins (coins).
In some cases, the issuance of cryptocurrency assets is gradual. For example, BTC coins are mined using mining. But in some startups, a one-time pre-issuance is envisioned.
The generated tokens are further distributed to investors and traders. There are many ways to market the pre-issued cryptocurrency. However, there are only 3 main methods of tokensale.
| Initial distribution | |||
|---|---|---|---|
| Features of tokensale | |||
| Raising finance | Developer | Centralized platform for trading cryptoassets | Distributed exchange (no administrator) |
| Listing fee (placement of cryptoasset on the platform) | Yes | Yes | No |
| Mandatory audit (verification) of the project | No | Yes | No |
| Restrictions on placement on cryptocurrency exchanges | Yes | Yes | No |
| Regulation | Depends on the regulations of the company that develops the project | Determined by the jurisdiction of the cryptocurrency exchange | No |
| Who is responsible for storing the funds | Developer | Exchange | Investor |
Financial metrics
In FA, accounting of the project’s economic metrics helps to make a more accurate prediction of changes in the market rate of a digital asset. An investor can take some of the financial metrics directly from exchanges.
However, most economic indicators are available only on blockchain monitoring services and cryptocurrency portals. Analysts often use the following financial indicators:
- Cryptocurrency network value (market capitalization).
- Trading volume per day and liquidity of tokens and koins.
- Cryptoasset supply mechanisms.
Capitalization
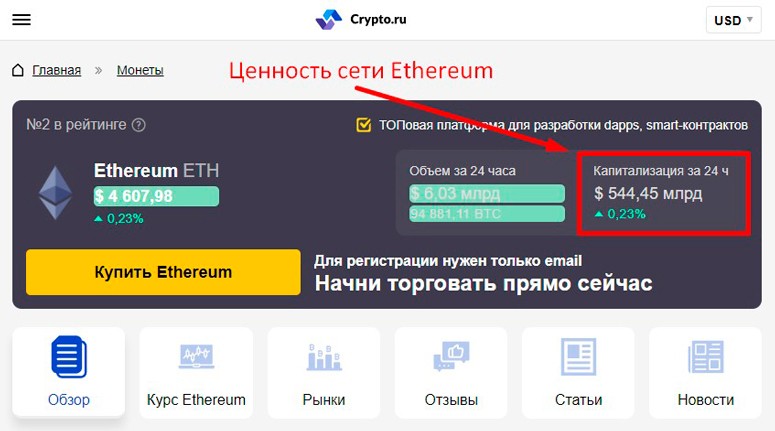
The value of a network is the multiplied number of coins or tokens mined by the current exchange rate of the asset. Market capitalization is usually calculated with the convention that they are all bought by investors. This notation is relevant for tokens that have not yet been distributed to users.
Market capitalization depends in part on the practical utility of the cryptocurrency. A digital project must solve a problem for users and meet their needs. Then investors will buy the coin or token and create a scarcity of the asset on exchanges, which will push its quotes up.
Volume and liquidity
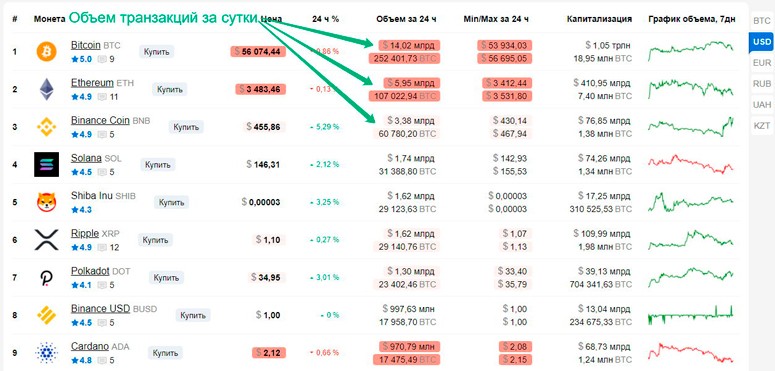
The amount of transactions (onchain metric) does not equal the trading turnover of a cryptocurrency (financial fundamental indicator). Buying or selling a digital asset through a special exchange is not always entered into the blockchain. Since such an operation is not technically a transfer in the network. Daily trading volume – the total amount of coins that were used in buy/sell transactions for the day on the crypto platform.
Liquidity – the demand for a cryptoasset, which allows you to sell it without a loss in the market price. The size of this fundamental indicator correlates with the speed of the transaction. The faster it is possible to sell a coin without loss in value, the more in demand it is considered.
Both trading volume and liquidity are important for fundamental analysis of cryptocurrency. These economic indicators are usually related to each other. If the volume of transactions is increasing, a trader can conclude that there is increased user interest. This is a positive premise for a digital currency. However, the volume of trades can also increase against the backdrop of a mass sale of cryptoassets due to panic.
Supply mechanisms
Many cryptocurrencies have limited issuance. For example, the maximum number of Bitcoins is 21 million coins. The last Bitcoin will be mined around the year 2140.
Supply mechanisms are the schemes for issuing new cryptoassets. There are 3 main algorithms:
- Gradually decelerating cryptocurrency issuance. Initially, there are 0 koins in the blockchain. Miners create blocks and confirm transactions than emit new cryptoassets. At first, nodes receive a large reward, but the network is designed to systematically reduce it. In the Bitcoin network, this process is called halving.
- Periodic burning of tokens. Developers issue currency at once in the planned amount, but provide a mechanism that reduces its supply. For example, the creators of the token Binance Coin issued 200 million BNB. Quarterly, the management of the crypto exchange allocates 20% of profits to buy back assets from the market and then burn them. The developers plan to reduce the supply to 100 million tokens. This creates an artificial shortage, which increases the market rate of the cryptocurrency.
- Elastic supply. Developers issue a fixed number of digital assets, but try to keep the price of the koin at the same level. This is possible thanks to the mechanism of reloading – reducing or expanding the circulating supply (the amount of cryptocurrency on the market) when necessary. Such an algorithm is used for стейблкоіни.
The first 2 mechanisms from the list above are designed to stimulate the growth of digital assets over a long period of time. Coins with elastic supply due to their own specifics can practically not bring profit to the investor. Every analyst and trader should take this into account.
Combining metrics and creating fundamental indicators
Researching only one metric gives a trader little useful information. Users should combine metrics to conduct a more accurate fundamental analysis of cryptocurrency.
An example would be an algorithm like this:
- A trader studies the news background, expert statements and sees that there is an unfavorable situation for cryptoassets in the market. This may be caused by a new law banning digital currencies or a vulnerability in the blockchain source code.
- A user opens the onchain transaction size metric and sees that the average amount of transfers on the network is increasing. From this, it can be inferred that large holders of koins are selling their savings to limit losses.
- A trader analyzes the liquidity of different assets and sees that this indicator is increasing for one digital currency and decreasing for another. This may indicate that large investors are trying to choose a safer investment option.
- By comparing these data, the user assumes a collapse of quotes and uses the situation to make money. To profit from the decline in the rate you can short (sell) cryptocurrency.
It is difficult to find the perfect combination of indicators and metrics on the Internet. Beginners should study the theory and develop their own methods of analysis. In order not to risk real money, it is recommended to do it on a demo account.
Mathematical evaluation of cryptoassets
Digital currencies bear little resemblance to fiat money. However, the market rate of coins can also be explained through arithmetic equations used by economists. There are 4 main mathematical ways to fundamentally analyze cryptocurrencies:
- The equation of exchange.
- Metcalfe’s Law.
- The dividend discount model.
- Cost of production.
By the equation of exchange.
This mathematical function was developed by American economist Irving Fisher in the early 20th century. In 2021, analysts use the exchange equation to explain the relationship between the number of coins and the price level of cryptocurrency within the framework of tokenomics. The ratio according to Fisher’s function looks like this: MV = PQ, where:
- M – market capitalization.
- V – daily trading volume.
- P – price of cryptoasset (in dollars).
- Q – issue rate.
Metcalfe’s Law
Analysts first applied this rule to cryptocurrency in 2014. Metcalfe’s Law says that the market capitalization of a digital asset is equal to the square of the number of users divided by half.
In 2017, Ken Alabi (a doctoral student at the State University of New York at Stony Brook) wrote a research paper to which he attached the results of using Metcalfe’s Law on BTC, ETH, DASH. He managed to find out that deviations of real indicators from predicted values can be used to identify bubbles in the cryptocurrency market.
The formula of Metcalfe’s law is as follows: N*N/2, where N is the number of users of the digital project (determined by the total number of existing wallets).
Dividend Discount Model
Dividend Discount Model assumes that the price of cryptocurrency is determined by the amount of expected income from digital coins. The amount of money invested by the trader directly depends on the benefit of the investment. The more profit the user expects to receive, the more actively he will invest in cryptocurrency.
The purchase of coins by the investor creates its additional scarcity on exchanges. This will inevitably increase the price of a koin or token. The higher the investor’s expectations, that is, his investment, the greater the deficit will be created by the investor, which determines the amount of growth in the market rate of the cryptocurrency.
Cost of Production
Cost of Production is a method of fundamental analysis of digital currencies that is gaining popularity in 2020-2021. This method has 2 valuation models:
- Stock-to-Flow (S2F).
- Bitcoin Energy Value.
In 2021, analysts more often use Stock-to-Flow in relation to bitcoin. S2F is used to determine the ratio of the total number of coins issued to the annual Bitcoin issuance. The higher the resulting figure, the greater the shortage of BTC in the cryptocurrency market. In combination with other metrics, this parameter allows you to predict the growth or decline in the exchange rate of the koin.
Bitcoin Energy Value – a model that gives the analyst the ability to determine the real value of bitcoin in terms of energy costs for mining one unit of cryptoasset. Data for the calculation can be taken from monitoring sites.
Підсумок
FA methods assume that the price of a cryptocurrency always tends to the so-called “real” value. In 2021, analysts use about 20 indicators of blockchain metrics, the cryptocurrency project and the coin itself.
In the world of digital assets, there are no perfect rules for performing analysis. There are only patterns and key indicators. Their competent use gives investors an understanding of the further movement of the market rate of cryptocurrency.
Поширені запитання
🤔 What does fundamental analysis give an investor?
With the help of FA methods, the investor determines the prospects for growth and decline in the price of cryptoassets. The investor makes trading decisions based on indicators.
❓ Does fundamental analysis work only for cryptocurrency?
FA methods are applicable to traditional assets as well. However, the methods of analyzing conventional financial markets often don’t work for cryptocurrencies.
📊 Which indicator is more important than the others?
Analysts use and combine all metrics. Relying on a particular indicator more than others in forecasting is not possible.
🔽 How does coin issuance decrease in Proof-of-Stake networks?
In a blockchain with a PoS consensus algorithm, crypto asset issuance is typically reduced by 30-45%. Developers reduce the reward when major network updates occur.
❌ Is elastic supply only used for stablecoins?
No, it can be an afterthought for developers of any project. But this issuance mechanism is disadvantageous for investors.
Ви знайшли помилку в тексті? Виділіть її мишкою та натисніть Ctrl + Заходьте.
Автор: Сайфедейський аммусексперт з економіки криптовалют.


