Coin trading is a popular way to make money in the crypto market. Traders can quickly increase their deposit several times and lose it just as easily. To reduce risks, experienced users develop strategies and calculate their profitability. PNL on Binance is a parameter that allows you to evaluate the results of trading. It shows the absolute value of profit or loss for the period.
What is PNL on Binance
This is a value that shows the financial result of trading on the market. If a trader earns, it will be positive. If the trader is losing, it will be negative. Binance clients can view the PNL of any position, the whole portfolio or download a report for a specific period. The data is generated separately for spot and futures markets or in the form of summary statistics for the account.
To calculate it is necessary to multiply the position size by the number of points from the entry to the order closing. After that, it is necessary to repeat the operation for all trades.
Difference with the concepts of ROI and ROE
PNL is an absolute value that shows whether the trader makes a profit in the market. But it is difficult to compare the success of two traders only by this indicator. Profit of $1 thousand without specifying the deposit size will not allow comparing the efficiency of funds utilization and risk levels.
The quantitative assessment is given by profitability indicators – by them you can determine which strategy is better. In this case, the size of investment does not matter. There are such indicators of profitability:
5020 $
bonus voor nieuwe gebruikers!
ByBit biedt handige en veilige voorwaarden voor de handel in cryptocurrency, lage commissies, een hoog liquiditeitsniveau en moderne tools voor marktanalyse. Het ondersteunt spot en leveraged trading en helpt beginners en professionele handelaren met een intuïtieve interface en tutorials.
Verdien een bonus van 100 $
voor nieuwe gebruikers!
De grootste cryptobeurs waar je snel en veilig je reis in de wereld van cryptocurrencies kunt beginnen. Het platform biedt honderden populaire activa, lage commissies en geavanceerde tools voor handelen en beleggen. Eenvoudige registratie, hoge transactiesnelheid en betrouwbare bescherming van fondsen maken Binance een geweldige keuze voor handelaren van elk niveau!
- ROI. From the English Return On Investment – “Return on Investment”. To calculate it, you need to subtract the investment costs from the profit and divide the obtained value by the initial order size. You will have to pay interest to the broker for holding a margin position. They may be higher than the profit on a closed order. In this case, even with a positive PNL, the return on investment will be negative.
- ROE. From the English Return On Equity – “Return on Equity”. To calculate it, divide the net profit by the account size. When studying the financial report, it may seem that the trader is successful. But earning $1 thousand from a deposit of $1 million is less than 0.1%. So, the capital is being used inefficiently. The trader could have gotten a higher return with less risk.
Types of PNL on Binance
Different data can be used to calculate the profitability of transactions. With the help of PNL, traders analyze statistics for a certain period or the financial result at the current moment.
Realized
This indicator is calculated only on closed transactions. While the order is in operation, the financial result can change. But after fixing the profit or loss is realized.
Realized PNL on Binance is calculated as the difference between the entry and closing prices of the transaction multiplied by the size of the position. From the resulting number, it is necessary to subtract the exchange’s commission for the execution of orders (opening and closing). You can calculate the value for a single order or a series.
Unrealized
Cryptocurrencies are highly volatile, so the market situation can change quickly. If a trade is not closed, PNL on it is considered unrealized. The parameter shows the current state of the account.
To determine the unrealized PNL on Binance, you need to calculate the difference between the entry and marking prices (the last one) and multiply the result by the order volume.
You can calculate the unrealized outcome of a single trade and all open positions.
Calculating Profits and Losses
In all cases, the calculation methodology is the same – the result in points is multiplied by the volume of the asset. The difference is only in the source of funds – equity or using a loan from a broker. The real size of the order should be substituted into the formula. On the futures market and with the use of margin, it can be larger than the amount on the account.
When trading on the spot
In this case, the calculation of the indicator is the simplest, since the trader uses only his own funds. For example, a client of the exchange buys 10 BTC at $30 thousand and sells it for $5 thousand more. When calculating, you need to take into account the exchange’s commission – 0.1% for regular users. The calculations are in the table.
| Parameter | Value |
|---|---|
In case of margin trading
There are additional costs to consider here. You will have to pay interest for using margin lending. In 2023, Binance charges a commission every hour – 1.46% in transactions with Bitcoin, 7.3% for altcoins.
If a trader trades on the whole capital with leverage, the position size can be larger than the amount in the account. Therefore, a small profit will be enough for a significant increase in the deposit. The calculation of the financial result when buying 10 BTC at $35 thousand and selling them for $40 in a day is shown in the table.
| Parameter | Value |
|---|---|
For futures
Trading in open-ended contracts has a peculiarity – you can open a position exceeding the deposit 50-125 times. But there is no need to pay interest, as in case of margin lending. Instead, the financing commission is calculated. The parameter is needed to smooth out the difference in quotes between the spot and futures markets.
Ideally, the price of a futures contract should be equal to the underlying asset. But in practice, the rate depends on the balance of supply and demand. Because of the high marginality of the market, there are skews. Therefore, every 8 hours some futures traders pay others.
If the price of a perpetual contract is higher than the underlying asset, the commission is charged to longs and transferred to shorts. If it is lower – vice versa. The rate of periodic payments changes every 8 hours. The actual value can be viewed at the top of the trading terminal.
High marginality carries another risk – manipulation. A large trader can sell a significant volume of an asset with maximum leverage. This will cause a second drop in the rate by 10% or more.
To avoid unwanted liquidations, the exchange has introduced the concept of marking price. To determine it, they use the index of the average value of the asset, which is determined by the data of several top exchanges.
When calculating the unrealized PNL of futures positions, a trader can choose a parameter – the marking price or the current one on Binance.
P&L calculators
Yield on closed or current trades can be viewed in the personal cabinet. In the trading terminal – unrealized PNL, in the report – realized Profit and Loss. This parameter is useful to calculate when making a trading plan. A trader can calculate it on his own or use the built-in calculators on the exchange.
Binance Margin
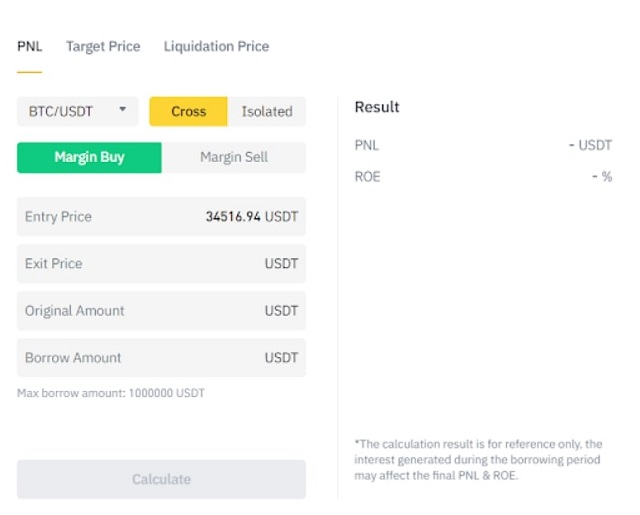
This tool is used when opening a leveraged transaction on the spot market. To calculate the position, you need to go to the trading terminal and click the calculator icon. On the PNL tab you will need to enter the following initial data:
- Ticker.
- Margin mode.
- Entry and exit prices.
- The size of equity and the amount of the loan.
To display the results, you need to click on the “Calculate” button. PNL value in USDT and ROE (%) will be displayed at the bottom of the page.
Binance Futures
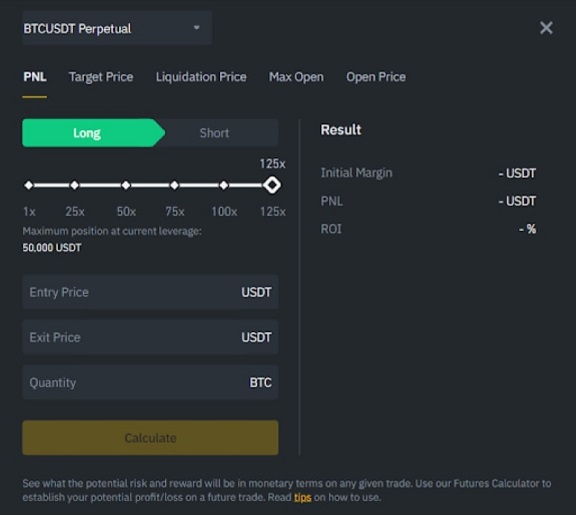
The tool is available in the futures terminal. To use it, you need to click on the icon or select “Calculator” from the menu. Clients can calculate the financial result at a given entry or closing price, order liquidation level or fixing rate (to get a specific ROI). To calculate it is necessary to go to the appropriate tab. It will be necessary to enter such data:
- Direction of the transaction.
- Leverage size.
- Entry and closing prices of the deal.
- Order volume.
Then you should click on the “Calculate” button. The initial margin (amount of margin), PNL and ROI will be displayed on the screen.
Where to view the PNL report on Binance
Exchange clients can evaluate the results of transactions at any time. Unrealized PNL should be viewed in the trading terminal (separately for each position) or in the “Wallets” section (“Margin”, “Futures”). The latter method is used to assess the overall state of the portfolio. It will allow you to determine how much money a trader can withdraw if he closes trades right now.
To analyze trading for a specific period, you need to order a report. The instructions are as follows:
- Open the “Wallets” section.
- Select the “Margin” or “Futures” tab.
- Click on the “History” button to view the results in tabular form or “PNL Analysis” for graphical display of information.
You can select the period – 7 days, 1 or 3 months, 1 year. Other intervals are also available. To select a specific period (not more than 12 months), you need to click on the icon on the right.
Binance stores the history of transactions only for a year. Therefore, it is better to evaluate the trading efficiency every quarter.
Analyzing the report
The main page displays the most important information – the financial result for today, as well as for 7 and 30 days. Users can share the result with other clients. It is necessary to click on the icon at the top of the screen and select a messenger to send a message. Other data is also available to analyze the trading performance:
- PNL for each day of the period. In this way, the trader can determine the most profitable and unprofitable sessions.
- Cumulative PNL. The block displays the equity (profitability graph) of the account in USDT. You can view your total PNL on the Binance exchange and evaluate the results more clearly.
- Total PNL (%). The tool allows you to determine which days brought the maximum loss or profit in relative units. Traders can compare the result with investments in BTC or BNB. User equity and coin quotes (calculated by marking price) are displayed in different colors on the chart.
You can study the charts and highlight the most useful days for analysis. When working on the strategy, the account is often at zero – the trader closes a small profit or loss. Income brings 1-2 successful days per month. A mistake will have to be compensated for several weeks.
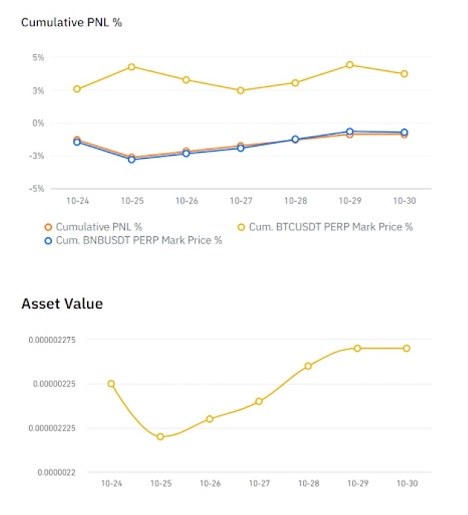
Sessions with a significant change in the account should be analyzed more carefully. To do this, you can click on the “Details” button. A list of transactions for each day will be displayed. It is necessary to determine the reasons for entry and the result of the operation. This will allow you to analyze mistakes.
FAQ
🔔 How to choose leverage in margin trading?
When using borrowed funds, there is a risk of liquidation. To prevent it, you need to put stop losses. Experts recommend not to risk more than 5-10% of capital in one transaction. You need to enter these data into the calculator, the leverage will be calculated automatically.
📌 How can I exclude the result of a deal on a particular strategy from the report?
You can’t do this on Binance. But you can use third-party services. To do this, go to the history and click on the “Export” button. The data will be written to an Excel file – you can import it into any application.
📢 What are the differences in calculating the result for long and short trades?
In the first case, a trader earns on the market growth, in the second case – on the fall. Therefore, when calculating the financial result for long positions, the opening rate is subtracted from the closing price of the order. For shorts, the opposite is true.
✨ Can I see a report on trades in different markets?
There is no such option on Binance. But you can export data and then merge it through a third-party application.
⚡ How can I assess the risks of a strategy using the financial result chart?
You need to study the “Cumulative PNL” block. If the line is sharp, with large drawdowns and quick recovery, the trader uses large leverages. It is also worth analyzing the history of trades. It is possible that the trader is not placing stops. In the end, this will lead to a loss of deposit.
Staat er een fout in de tekst? Markeer het met je muis en druk op Ctrl + Enter.
Auteur: Saifedean Ammous, een expert in cryptocurrency-economie.
