Traders can predict future digital coin rates by studying past price movements. Technical analysis is based on the idea that history repeats itself. Guided by the methodology, it is possible to determine likely market entry and exit points using indicators, trading lines and trading volume data. This material will reveal the basics of technical analysis of cryptocurrencies for beginners. Knowing the rules and patterns by which the market works allows you to make money on changes in coin rates without evaluating protocols and tracking news.
What is technical analysis of cryptocurrency charts
This method is considered one of the key to profitable trading in financial markets. Traders make predictions of price movements by analyzing past asset charts.
The basic postulate of technical analysis states: in similar situations, market participants perform the same actions.
They are controlled by emotions – fear, panic, greed, euphoria. Knowing these peculiarities, we can guess how events will develop in the future. Such tools are used in technical analysis:
- Indicators. With their help, you can get signals about the likely direction of movement of rates. Mathematical formulas are used for calculation.
- Figures. This is a sequence of candlestick formation, which forms recognizable graphical patterns. Based on them, users can make trading decisions – to buy, sell or stay out of the market.
- Trend lines. Traders connect the highs or lows of the price. Line breakdowns and bottom/top tests indicate a change in trend.
- Trading volume. Watching cash flow helps to make more successful trades.
History of creation
Technical analysis originated long before the emergence of cryptocurrencies. It was first used to predict rice prices in Asia in the 18th century. Japanese trader Homma Munehisa used it to look for patterns of rate movements on candlestick charts. Contributors to the formation of thechanalysis also included:
5020 $
bonus voor nieuwe gebruikers!
ByBit biedt handige en veilige voorwaarden voor de handel in cryptocurrency, lage commissies, een hoog liquiditeitsniveau en moderne tools voor marktanalyse. Het ondersteunt spot en leveraged trading en helpt beginners en professionele handelaren met een intuïtieve interface en tutorials.
Verdien een bonus van 100 $
voor nieuwe gebruikers!
De grootste cryptobeurs waar je snel en veilig je reis in de wereld van cryptocurrencies kunt beginnen. Het platform biedt honderden populaire activa, lage commissies en geavanceerde tools voor handelen en beleggen. Eenvoudige registratie, hoge transactiesnelheid en betrouwbare bescherming van fondsen maken Binance een geweldige keuze voor handelaren van elk niveau!
- Charles Dow (1851-1902). He founded The Wall Street Journal and published a series of articles analyzing the American stock market. His method is now known as the “Dow Theory”.
- Richard D. Wyckoff (1873-1974). Began his career as a stockbroker and founded his own company at the age of 25. Developed a methodology for analyzing supply and demand, according to which any move in the market can be divided into 4 stages – accumulation, price momentum, distribution and downward movement. Wyckoff’s model has been successfully used for over 100 years in the stock and cryptocurrency markets.
- Ralph N. Elliot (1871-1948). Developed the wave theory of stock market movements.
- William Gunn (1878-1955). Believed that anyone can succeed in the market if they use methods of mathematical forecasting of rates. He developed such tools as “Gann’s angle”, “Gann’s grid”, Gann’s fan” and others.
The theory of techanalysis
Beginning traders may think that cryptocurrencies move chaotically. But supporters of technical analysis believe that it is possible to find patterns on the charts and predict the future direction of quotes. The movements on financial markets help to predict the study of crowd psychology. The main idea is that in similar conditions traders behave the same way under the control of emotions.
To apply techanalysis it is not necessary to take into account the news or the fundamental of the asset. It is believed that all factors that can influence the rate are already embedded in the price.
Proponents of the method can build a model of the asset movement, determine the entry and exit points of the position. Then the news will be released, which will serve as a trigger for the execution of the forecast.
The purpose of thechanalysis
There are 2 categories of participants in the market: sellers and buyers. With the help of forecasting tools, you can determine who is stronger in a particular period and take a profitable position. The main goals of cryptocurrency techanalysis are:
- Determine the trend.
- Find support and resistance levels.
- Take into account additional factors – indicator readings, trading volumes, figures or patterns.
- Open a trade near one of the price levels with a small stop (an order limiting losses) and a long take (an order to lock in profits).
Soorten
Market participants use different algorithms to search for patterns and collect statistics on the probability of their working out. You can use one method or combine 2-3. There are several types of technical analysis of cryptocurrencies with unique methods and approaches:
- Graphical. You need to find patterns on the chart and build support and resistance levels. You can use sloping and horizontal lines. Depending on the strength of the pattern and the trend, a rebound or breakout of the level is predicted. The exit point is determined by the height of the pattern, Fibonacci levels or stop/stake ratio.
- Indicator-based. Traders use additional tools to mathematically calculate the historical chart and get signals. Usually a trading system consists of 3-5 indicators. When 2 or more signals coincide, traders enter the market. The position is closed on the opposite signal.
- Volume analysis. In this case, the number of purchases and sales for a certain period is considered. There are indicators of vertical and horizontal volumes. The first shows the amount injected into the market for a certain time, the second – at a given price level. Usually traders use these indicators to confirm the truth of the trend. If the volume grows when the level is broken, it is most likely not false. The direction of movement will not change. If the indicator falls, the trader enters a reverse transaction, predicting a pullback from the level.
- Candlestick analysis. This is another popular method. Price fluctuations are often depicted in the form of Japanese candles. Body – the range of opening and closing. Shadow – how much the price has risen or fallen. Traders study the combinations. They make predictions about the future movement of digital assets. So, if the candle has no shadow, it means that the market has enough strength to continue moving. A lot of “flights” behind the level with shadows, but the closing of the body above (below) the level of support (resistance) speak of a probable rebound.
Principles of technical analysis of cryptocurrencies
Unlike other ways of predicting money markets, this methodology allows you to determine the levels for entering a transaction, a clear direction of the rate and the size of take profit. Technical analysis of cryptocurrency charts does not give a 100% probability of fulfillment of the forecast.
Sometimes the market goes against the trader’s position, but most trades are closed in the plus. Therefore, with clear adherence to the strategy and competent risk management, you can get a stable income.
Market events are repeated. They may differ, but the general pattern of movement is preserved. Patterns do not depend on the coin or timeframe. Therefore, the methodology can be used for short-term trading of any assets and investments.
The same reaction of market participants
This postulate is based on the psychology of the crowd. Crypto market participants react to events in a similar way under the influence of emotions. Therefore, all possible scenarios are already present on the charts. It is only necessary to identify patterns and enter the transaction when a signal appears. Understanding the principles of the same reaction of market participants allows you to make more informed decisions when conducting transactions with cryptocurrencies.
Price movement according to trends
Quotes of cryptoassets fluctuate according to the trend. But the trend is not seen as a straight line, it contains a series of consecutive minimums and maximums. Price movement can be divided into 3 types:
- Flat – the price fluctuates in a range.
- Uptrend – quotes are fixed above the flat. At the same time, each minimum is higher than the previous one. Within a long trend there may be periods of flatness or correction, but the price establishes a new high.
- The downtrend – usually begins after a prolonged trading on the market hayes. At the initial stage it is impossible to say whether it is a fresh trend or a correction within the uptrend. The first signal for a change of direction is the establishment of new lows and lack of market forces for upward movement (highs are declining).
The key to success in trading is the correct identification of the prevailing trend and timely response to the change of direction. The easiest way to trade on the trend. Even with an inaccurate entry, the deal will close in the plus. With competent risk management you can earn in sideways trends.
Displaying price factors in charts
Followers of technical analysis of cryptocurrencies do not track parameters that can affect the quotes of digital assets:
- Political and economic events.
- Development of platforms – adding new features, listings on exchanges, participation of large investors.
- Project prospects.
The price is considered to take everything into account. Therefore, the rate is set at a fair level relative to the combination of these factors and the future expectations of investors.
Rules for thechanalysis of the cryptocurrency market
The trader’s task is to identify patterns in the movement of rates, test them on history and develop risk management. When creating a trading system on the technical analysis of cryptocurrency charts, you should follow these rules:
- Do not try to analyze the fundamentals of digital assets. Also, there is no need to study the team and technology of the project.
- Ignore the news background. It is likely that the released information will be a trigger for the fulfillment of the goal of cryptocurrency thehanalysis. When important statistics that can change the trend appear, you can not trade or enter with a smaller volume.
- Pay attention only to the chart and indicator readings. All cryptocurrencies are essentially the same.
- You can trade short and long.
- If the situation changes, it is necessary to exit the transaction on the stop.
What are timeframes
The chart of cryptocurrencies consists of periods, each of which is displayed in the form of bars or candles. The timeframe is used for convenient perception of information. The most popular periods can be seen in the table.
| Timeframes | Uitleg |
|---|---|
Varieties of price charts
The exchange terminal allows you to display cryptocurrency quotes in different ways. You can track changes at any point in time from the listing of the coin. Each point on the chart is a trading period. The user can get such information:
- The opening and closing price of the period.
- Minimum and maximum rates.
- Weighted average price.
More than 10 different variants of displaying historical charts are available in trading terminals. Some allow you to familiarize yourself with the maximum data, others show only the main thing, price noise is ignored.
The most popular types of charts are lines, candlesticks and bars. Users can customize them according to their preferences.
Linear
This is the simplest type of displaying historical data on cryptocurrency rates. The chart is built in the form of a curve, each point of which corresponds to a timeframe.
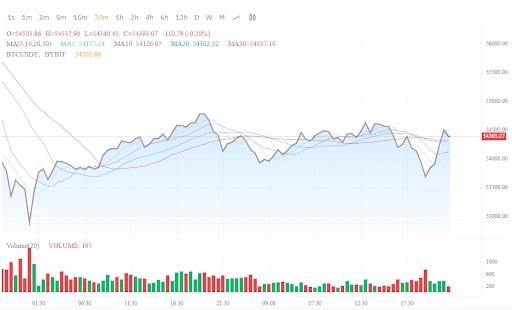
Only one price is displayed on the screen, by default – the closing rate of the period. But you can change it in the exchange terminal.
Bars
Such price charts contain full information about the behavior of the asset at each point in time. Users can find out:
- Deopening and closing quotes of the period – displayed by serifs on the left and right.
- Minimum and maximum prices – the lower and upper points of the bar. If the left serif is higher than the right one, the price has fallen, if it is lower – it has risen. This is the main difference between bars and Japanese candlesticks. Only one color is used to show the direction. The default color is green, but it can be changed in the terminal settings.
Japanese candlesticks
The chart contains as much information as when using bars. Japanese candlesticks consist of 2 components – body and shadow.
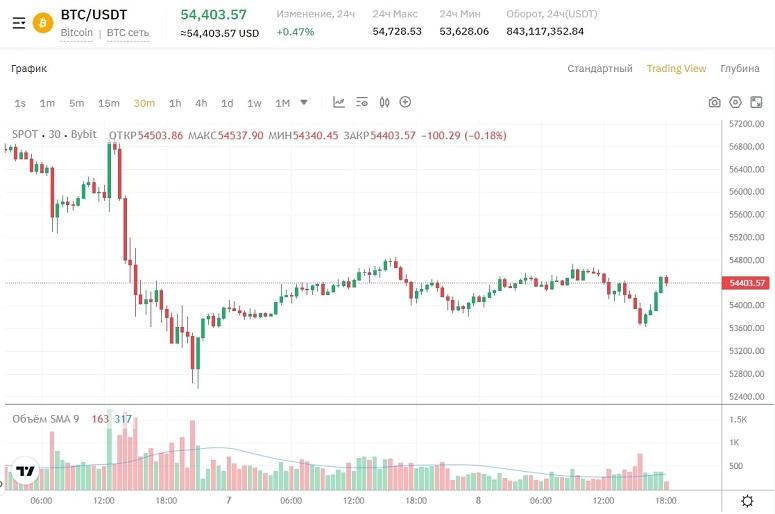
To analyze the coins in the cryptocurrency market by charts, you need to interpret candlesticks. The state of the components is deciphered as follows:
- The body is a painted rectangle, the top and bottom of which correspond to the opening and closing prices. If the rate fell, it is denoted by red color, rose – green.
- Shadow – a stick at the top and bottom of the candle body. They correspond to the maximum and minimum for the period.
The main patterns and models of technical analysis of cryptocurrencies
Graphical figures display the behavior of participants in different phases of the market. Some indicate a flat, others – a continuation of the trend or a reversal. Some of the figures can be interpreted differently depending on the context. The table contains the main patterns of technical analysis of cryptocurrencies.
| Figure | Predicted direction |
|---|---|
Patterns cannot guarantee 100% accuracy of the forecast. Therefore, when trading on patterns, you should necessarily put a stop outside the range boundary and use additional tools – fundamental analysis and volume indicators.
Rectangle
The pattern is formed when the price is in the range created by two horizontal (or slightly inclined) lines for a long time. The pattern usually indicates the continuation of a trend, if there was a clear trend in the market before its formation (unidirectional movement for at least 2-3 weeks).
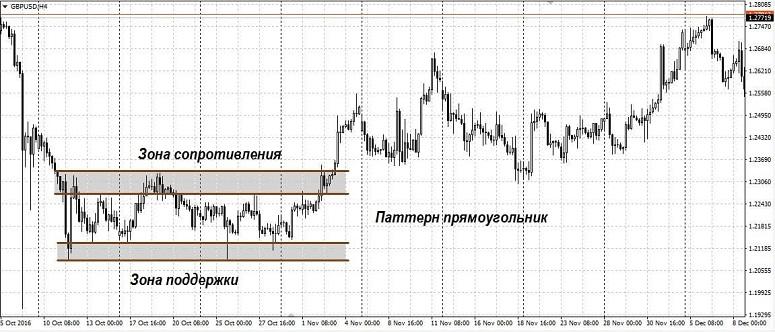
There are 2 trading methods that can be used – a breakaway from the boundaries and a breakout. The peculiarities of each are as follows:
- Boundary Rebound. The trader waits until the top or bottom of the pattern is touched and opens a trade in the opposite direction. The goal is to reach half of the rectangle, the stop is behind the support/resistance lines.
- Breakout. A trader opens a position after price fixation above/below the range boundaries. A true breakout is accompanied by volume growth. A powerful impulse follows after the exit from the rectangle. The longer the figure was formed, the greater will be the scope of the subsequent movement.
Wedge
The pattern visually resembles a triangle, but its edges narrow and look in one direction. The range of movement and trading volumes are decreasing. The pattern indicates uncertainty on the market and a soon change of the trend.
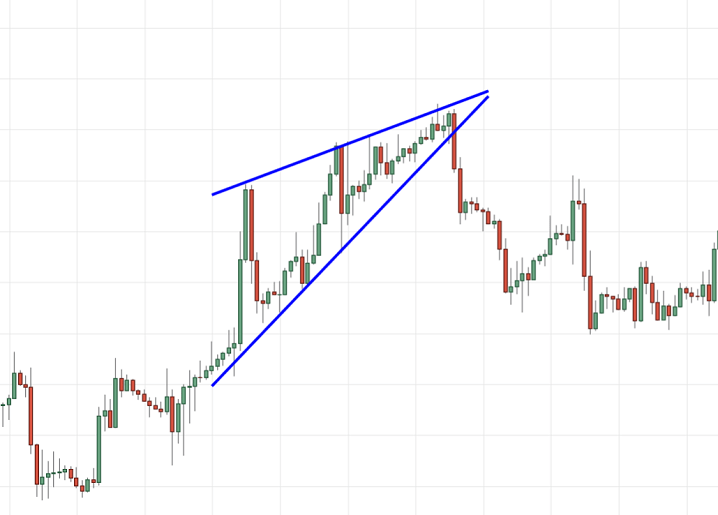
It is not recommended to trade inside the figure. If the edges of the wedge are very close, and the breakout has not occurred, the pattern is considered degenerated (has no strength).
Triangle
This is a simple pattern that often appears on the chart during periods of uncertainty. The price consolidates in a range formed by two sloping or horizontal lines.
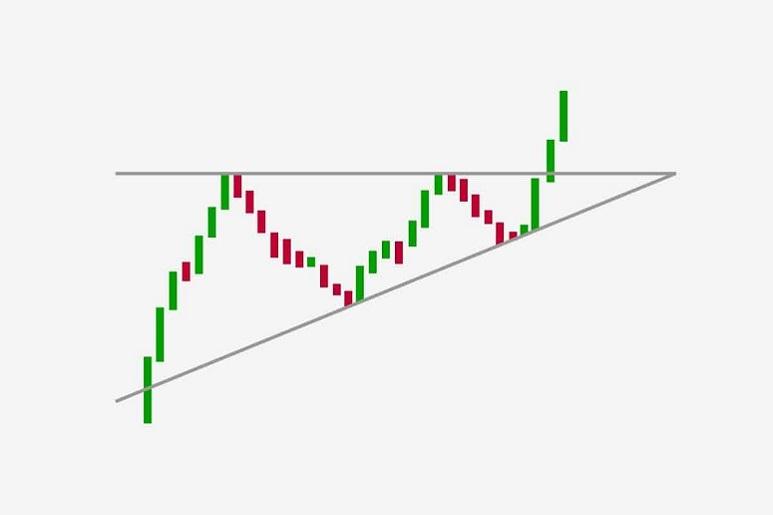
Transaction volumes are decreasing, volatility is falling. There are different types of triangles:
- Ascending. Buyers of the asset are bumping into a strong resistance. Each minimum is higher than the previous one. The continuation of the growth of the asset is likely.
- Downtrending. Sellers cannot break through the support level. The bulls have no strength to establish new highs above the previous ones. Such triangles are more often broken downward.
- Symmetrical. The forces of bulls and bears are equal, so the figure can open in either direction.
Double top
The figure indicates the imminent reversal of the trend. It consists of two highs located at approximately the same level.
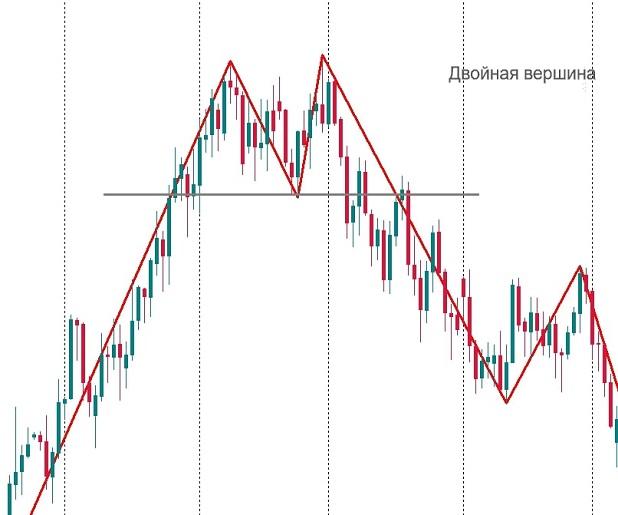
There are 3 varieties of the pattern. The conditions of formation are as follows:
- The highs are located at the same level.
- The second peak is lower than the previous one.
- The first extremum is overwritten, but then a reverse movement follows. The price goes behind the level with a shadow (closing of the body below the line).
The probability of fulfillment of the forecast increases if the figure is formed on the daily or weekly chart and is accompanied by divergence on the RSI or MACD indicator. It is possible to enter a position at a pullback beyond the resistance level. The stop should be placed behind the extremum. This is an aggressive method. A conservative option is to enter after the breakdown of the local minimum.
Double bottom
This reversal pattern indicates the imminent end of the downtrend:
- Consists of 2 lows at about the same level.
- It is formed near a strong support, which cannot be broken at the second attempt.
At the same time, the volumes should decrease on falling quotes, and increase on the growth. It works on all timeframes, but on 5 and 15-minute charts the movement to the target is less than on daily and weekly charts.
Head and Shoulders
This reversal pattern visually resembles 3 mountains, with the middle one higher (lower) than the other two. It indicates that the market lacks strength to continue the trend.
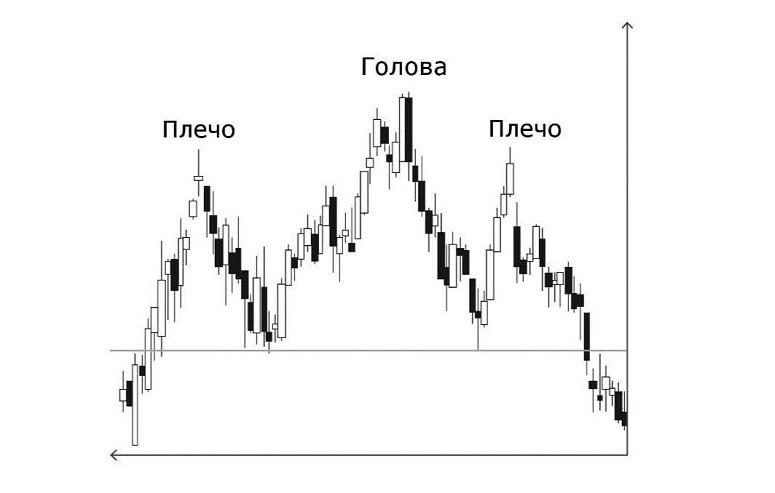
Positions should be opened following the formation of the second shoulder (stop behind the head) or at the breakdown of support. The latter option is safer, but the risk is higher. The trader will have to set a larger stop.
Technical indicators
With the support of these tools for analyzing cryptocurrencies, traders can assess the current state of the market and predict its further movement. Technical indicators help to establish the trend direction, volatility, overbought or oversold asset and predict a change in trend. Using several tools in combination with other means of analytics, crypto traders increase their chances of profitable trades.
Trend Indicators
A single movement in the market can be a fluke, a sequence of fluctuations in a particular direction is a trend. Indicators serve to determine the priority trend on the selected timeframe and warn about changes in the situation. The most popular tools are:
- Moving averages (MA). This is one of the most simple trend indicators, which allows you to smooth out price fluctuations. There are simple, exponential and weighted average simple moving averages. The peculiarities of the last two are that the extreme quotes are given more weight. This allows to determine the trend direction more accurately.
- Ishimoku Cloud. This technical indicator consists of several moving averages with different periods. It is used to determine the trend and the strength of the impulse, points of entry and exit from the position.
- Fibonacci Levels indicator. The tool is used to determine the trend and possible movement targets in percentages. The chart, which displays the psychology of the crowd, is built according to the rules of the golden ratio. The string of numbers was discovered by the mathematician Fibonacci in the 13th century and consists of a series – 23.6%, 38.2%, 61.8%, 161.8%, 261.8% and 423.6%. The first 3 values show the probable correction levels, the last ones – the movement targets.
Momentum Indicators
Traders use these tools to determine the strength of the trend. Indicators measure the speed of movement of an asset for a specific period. With their help, you can predict the beginning of the impulse and its probable fading. The most popular tools are:
- Relative Strength Indicator (RSI). It helps to identify areas of overbought/oversold price. A correction is more likely to follow from them.
- Stochastic Oscillator (SO). Compares the closing price of the period with a certain range (can be set in the settings). This allows you to find overbought/oversold areas with greater accuracy.
- Moving Average Divergence (MACD). The values of two MAs – fast and slow – are compared to determine the strength of the trend. When the lines converge, it indicates that the impulse is fading and the correction is imminent. When diverging, the trend is gaining strength, so you can build up your positions.
- Momentum indicator (MOM). It generates advance signals about trend changes. To determine the strength of the momentum, the increment for the period is compared with some range in the past. If the momentum reaches a new minimum or maximum, it indicates a higher probability of trend continuation. If the price is growing and the indicator starts to decline, we can conclude that the impulse is fading and the correction is about to begin. The most reliable signals are generated on timeframes above M30.
Volatility indicators
The size of fluctuations in the rates of cryptoassets is not constant. To determine volatility, special indicators are used. Among the most popular are Bollinger Bands. Graphically, the tool represents 3 lines, 2 of which limit the range from the top and bottom, and the third is the middle between them.
Bollinger Bands are drawn at a distance equal to a certain number of standard deviations. Its value depends on volatility. Therefore, during the period of instability, the bands expand, while in a calm market they narrow.
About 90% of the time the rate moves inside the band, so when approaching the top or bottom, it is better to close positions. It is not necessary to open a deal on a rebound from the boundaries. At the breakdown, the impulse can be very powerful.
Volume indicators
Traders can improve the outcome of trades if they take cash flows into account. Trading volumes are considered a driving force in the market. A popular indicator to describe them is On-Balance Volume (OBV). It works like this:
- If a new period candle closes higher than the previous one, the volume is added to the total.
- If it decreases, the trading turnover is subtracted.
Graphically, the indicator represents a line, which can be either positive or negative. If the volume suddenly changes without a sharp movement of the exchange rate, it means that large players accumulate positions. “Whales” are buying the asset when small traders are selling. So, we can expect a significant growth momentum soon.
Oscillators
These tools are used when trading in a sideways market. It is believed that most of the time cryptocurrencies move in flat when there is no clear trend.
Oscillators help to find overbought and oversold levels.
They work when the probability of a short-term trend change is maximized. Traders use these indicators for confirmation when opening a trade on a bounce from the boundaries of trend channels or figures of technical analysis of cryptocurrencies.
Trading styles
Beginning crypto traders are initially recommended to work without shoulders on 4-hour and daily charts. After gaining the necessary experience, you can choose a tactic:
- Intrade. Transactions are closed on the same day, which avoids the impact of overnight events on the market.
- Position trading (swing trading). Open trades are held for several days to weeks.
- Scalping. This involves making many quick trades in a short period of time to capitalize on small fluctuations in the exchange rate. Leverage is most often used in this tactic. Cryptotrader should monitor changes in the market and in case of unfavorable development quickly close the loss.
The choice of trading style depends on the goals, the level of risk and the time that the user is ready to devote to operations in the market. If for scalping it is better to work with 1-2 cryptocurrencies, then for position trading it is possible to open transactions on dozens of coins. Creating a well-diversified portfolio reduces risks.
Possible mistakes when techanalyzing cryptocurrencies
The effectiveness of the methodology strongly depends on the emotions of the performer. Beginning cryptotraders, who have not yet learned to remain calm in any situation, make a number of mistakes that lead to losses:
- Insufficient understanding of the main tools of technical analysis of cryptocurrencies (patterns and indicators). Their incorrect application can lead to erroneous conclusions.
- Overconfidence in your predictions without confirmation by additional research. This can lead to rash decisions and financial losses.
- Under-earnings. A crypto trader may, under the influence of fear or greed, violate the rules of the trading system and not fix the dividend, enter the market too late or close the transaction after making a small profit.
- Attempt to “win back”. After a series of losses, a user may make haphazard transactions in the hope of quickly recouping losses. This leads to negative consequences.
- Making unsystematic transactions. A cryptotrader breaks his rules because of the advice of famous bloggers.
It is necessary to remember the influence of external factors on the digital market, such as news, regulation and world events. Therefore, you need to put stops and do not expect the price to return to the entry level. For effective technical analysis of cryptocurrency charts, you need to study the market and constantly improve your skills.
FAQ
📢 What are the character traits that help you to trade by techanalysis?
The main qualities are cold-bloodedness and lack of excitement. Accuracy, diligence and mathematical mind will be advantages.
🔔 What indicators are better to use?
You can take as a basis a popular trading system and test it on history. Then you need to modify it – some indicators to remove, others to add for greater profitability.
✨ Why does cryptocurrency thechanalysis does not always work?
The best results can be obtained in a calm market. Sometimes important data is released that is able to reverse trends on large timeframes. These events cannot be predicted with tools.
🔎 How to avoid losses?
This is part of a trader’s job. You can’t do without mistakes. It is necessary that profits from successful trades overlap minus positions.
📌 How much time per day do beginners need to trade to gain experience?
It is believed that a person cannot maintain high concentration for more than 2-3 hours in a row. In order not to make mistakes, it is necessary not to “overtrade” and not to spend too much time at the terminal.
Een fout in de tekst? Markeer het met je muis en druk op Ctrl + Enter.
Auteur: Saifedean Ammous, een expert in cryptocurrency-economie.


