The value of assets depends on supply and demand. Fundamentele analyse will help to determine the mood of the market. Indeed, there is a lot of news about popular coins such as bitcoin or etherium on a regular basis. It is much more difficult to analyze the situation with other digital assets. To do this, resort to statistical indicators, for example, the cryptocurrency stack. This simple tool is available on many trading platforms.
What is the exchange stack of cryptocurrency
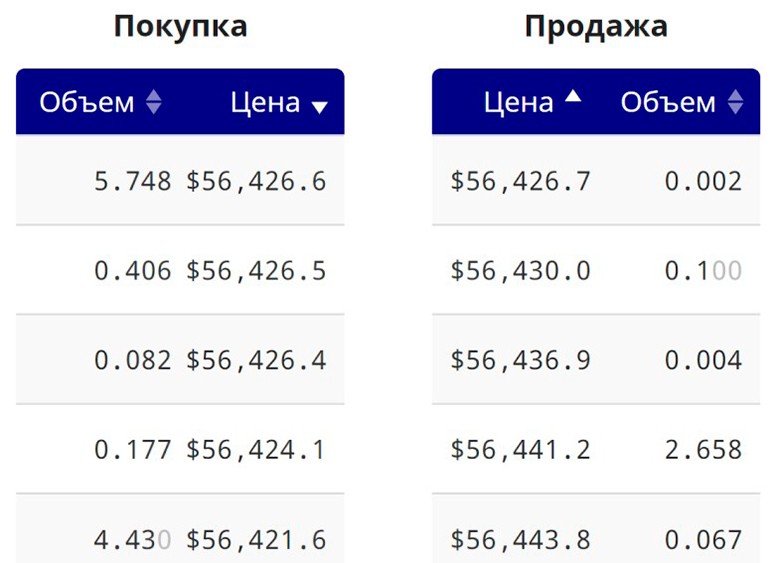
This is a table of limit bestellingen to buy and sell a certain asset. Such a tool is used not only on cryptocurrency platforms, but also on stock, currency and commodity exchanges. It is also called an order book.
To display the stack, the software summarizes all orders at the same price to show the total supply and demand. Depending on the interface, this tool may look like a table.
| Number of assets to buy | Rate | Amount of assets to sell |
|---|---|---|
| $60 003 | 130,16 | |
| $60 002 | 30 | |
| $60 001 | 21 | |
| 105 | $60 000 | |
| 38,7 | $59 999 | |
| 235 | $59 998 |
This is an example of an outdated format. For convenient display, cryptocurrency exchanges separate buy and sell orders into 2 separate tables.

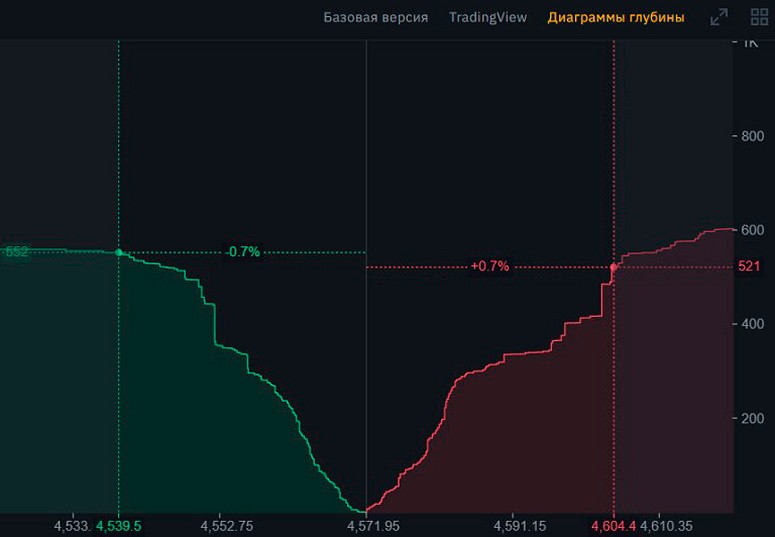
The exchange stack is displayed in the form of a chart. Due to this, it is much easier and faster to find a large cluster of orders at the same price.
5020 $
bonus voor nieuwe gebruikers!
ByBit biedt handige en veilige voorwaarden voor de handel in cryptocurrency, lage commissies, een hoog liquiditeitsniveau en moderne tools voor marktanalyse. Het ondersteunt spot en leveraged trading en helpt beginners en professionele handelaren met een intuïtieve interface en tutorials.
Verdien een bonus van 100 $
voor nieuwe gebruikers!
De grootste cryptobeurs waar je snel en veilig je reis in de wereld van cryptocurrencies kunt beginnen. Het platform biedt honderden populaire activa, lage commissies en geavanceerde tools voor handelen en beleggen. Eenvoudige registratie, hoge transactiesnelheid en betrouwbare bescherming van fondsen maken Binance een geweldige keuze voor handelaren van elk niveau!

Displayed orders
Only pending (limit) orders with a set price fall into the cryptocurrency stack. Among other features stand out:
- Anonimiteit. The trading platform does not disclose the names of users who created orders.
- Equivalence. It is impossible to know which orders were created with their own funds, and which were created with borrowed funds.
- No large traders. The exchange does not provide information about the number of participants who created an order with the specified rate.
Some anonymous exchanges do not provide data on current orders. Completed trades are also not available for public viewing.
Who fills in
All traders participate in the formation of the stack – they are divided into buyers and sellers. As soon as a user creates a limit order, it immediately enters the order book and is displayed until one of the two conditions is met:
- Closing of the trade. The price will reach the set level and another user will buy or sell the asset at the specified rate.
- Canceling the transaction. At any moment the trader can remove the order.
Participants are divided into several main categories:
- Trading robots. Some traders use automated programs. They make up to several hundred deals per day. When analyzing the order book, it is impossible to know who exactly is trading – a robot or a human.
- Scalpers. Traders earn even on insignificant fluctuations of the asset price during one day. They do not particularly affect the rate movement, as they more often parasitize on large orders.
- Market makers. They act as the main liquidity providers and try to make money on the spread – the difference between the buying and selling rates. Market makers are interested in maintaining the current price level and reducing their risks.
- Private investors and professional traders. They make up the absolute majority on the stock exchange. They are characterized by randomness and unpredictability, as everyone acts according to their own strategy.
- Large players and investment funds. Such users are the least, but because of their huge capital they significantly move the market.
Buying side
It prevents the price of an asset from falling. All buy orders are usually marked in green color. If an impressive amount of assets is gathered at a certain price, a support level is formed.
The selling side
It does not prevent the price from rising. All sell orders are usually marked in red. If a large sum of assets is put up at the same rate, a resistance level is formed.
Influence on the price of cryptocurrency
The rate of the asset directly depends on supply and demand. When many newcomers appear on the trading platform, they have only one option – to buy cryptocurrency. Because of this, the influx of users provides a rise in price.
The greatest influence is exerted by whales – large players. If such a player sells an asset at the market, it can significantly reduce the current value. Unfortunately, it is impossible to predict the appearance of a whale on the exchange.
What is a tape of transactions
Exchanges provide information on all exchanges. The transaction feed contains the following information:
- Het tijdstip van de transactie.
- The number of assets bought or sold.
- The exchange rate.
Buy deals are displayed in green color, and sell deals are displayed in red. The tape helps to determine the current mood of the market.
How to analyze the stock exchange stack
Understanding the depth of the market comes in handy for a trader when making a forecast. This is a useful tool for both technical and fundamental analysis. When working with the cryptocurrency stack, the following factors are taken into account:
- Cancellation of orders. Traders can cancel an unexecuted order at any time. Canceling sell orders signals a possible rise in price. Traders are willing to keep the cryptocurrency in order to sell it at a more favorable rate in the future.
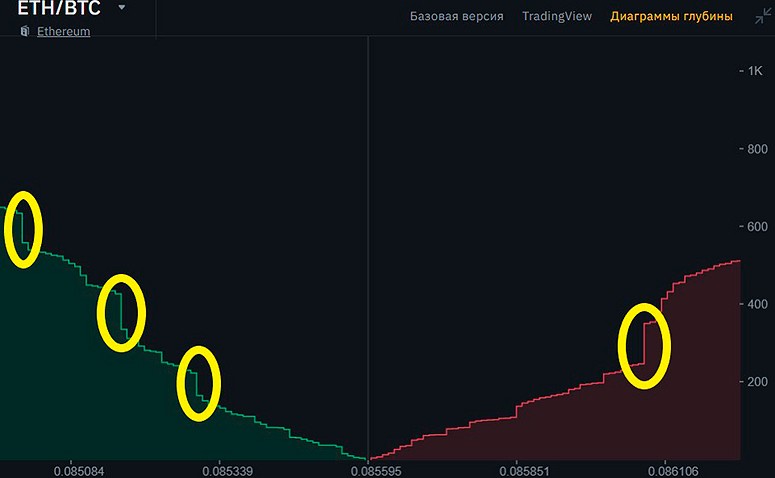
- Support and resistance levels. When a large number of orders are collected at one price, “steps” are formed – they are easy to notice on the depth chart. They keep the price in a certain range, because of which the market remains flat for a long time.

With the help of the glass, a trader needs to estimate the probability of maintaining the current market state: whether it will remain flat, or the strength of the trend will be enough to break through the support or resistance level. Depending on the forecast, different approaches are used.
Trading strategies
There are 2 simple approaches to trading that can be quickly mastered by a beginner:
- Flat strategy. The user trades within a certain range, which is set by support and resistance levels. For example, the price of BTC may fluctuate between $55,000-$60,000 for several weeks. Buy orders in this case are placed closer to the support level – $55,900. To sell also leave a small difference from resistance, for example, $59,100.
- Trend strategy. This is the second common way of trading in the cryptocurrency market. The value of the assets has risen noticeably recently. The price of bitcoin on December 7, 2019 was $7556, and 2 years later it rose to $51,000. During this time period, BTC has updated the highs. At a distance, a trending strategy will bring much more profit than a flat strategy. The trader’s task: to determine the probability of overcoming resistance in order to buy the cryptocurrency in time to capitalize on the growth.
There is an alternative way to trade on a short distance. When the support and resistance levels are broken, the rate continues to move and changes by another 5-10%.
If the bears managed to sell BTC support at $55,000, the price will quickly drop to $52,000 or the next large cluster of orders. They take advantage of this and place a limit order in advance. Experienced traders often place a whole grid at different levels.
Samenvatting
The exchange stack is one of the main tools in cryptocurrency trading. It doesn’t matter what strategy a trader chooses. He still has to reckon with the intentions of other market participants. Fortunately for beginners, anyone can learn how to use the stack.
Veelgestelde vragen
🥤 Is bitcoin staking available on all exchanges?
Such information is provided by most popular cryptocurrency trading platforms. The exception is anonymous exchanges that hide transaction details.
❓ Why are large traders hard to recognize?
Whales try to hide their presence. To do this, instead of one large order, they create several small orders with different values.
💡 For which strategies is the stock chart suitable?
It is effective for short-term trades.
🔎 How to learn how to analyze the order book?
The best helper is personal observation. Traders act in the same way in certain situations, and the betting book will help to find similar patterns.
🔥 When does the order book become ineffective?
The usefulness of this tool directly depends on liquidity. If a trading pair is not in demand, it will be more difficult to predict the rate movement.
Staat er een fout in de tekst? Markeer het met je muis en druk op Ctrl + Enter.
Auteur: Saifedean Ammous, een expert in cryptocurrency-economie.


