The mood of the market is formed by its participants. The fear and greed index of bitcoin and other cryptocurrencies shows the willingness to buy or sell assets. A simple tool has turned into a trading signal that is easy to use.
What is the Fear and Greed Index
Initially, this parameter appeared to analyze the stock market. Then it began to be used in a related industry. With its help, you can quickly determine the type of trend – bullish or bearish.
In extreme conditions (for example, when the bitcoin rate collapses), investors behave irrationally. Market participants start throwing away assets and closing losing positions, reinforcing the bearish trend and provoking a dump. Against the background of good news about bitcoin, a different situation is observed – traders are ready to buy cryptocurrency.
What is measured for
The indicator summarizes several parameters. Having determined the mood of the market, you can adjust the forecast for the price of BTC, the probability of breaking resistance or support.
The index is measured from 0 to 100. If the value is close to the maximum, investors are driven by greed. They are ready to invest in cryptocurrency. However, the bullish trend does not last forever. Greed is eventually replaced by fear. This can happen both on the background of negative news and due to the desire to lock in profits.
Data for determination
The index depends on 6 parameters.
5020 $
bonus for nye brukere!
ByBit gir praktiske og trygge forhold for handel med kryptovaluta, tilbyr lave provisjoner, høyt likviditetsnivå og moderne verktøy for markedsanalyse. Den støtter spot- og leveraged trading, og hjelper nybegynnere og profesjonelle tradere med et intuitivt grensesnitt og opplæringsprogrammer.
Tjen 100 $ i bonus
for nye brukere!
Den største kryptobørsen hvor du raskt og trygt kan starte reisen din i kryptovalutaverdenen. Plattformen tilbyr hundrevis av populære aktiva, lave provisjoner og avanserte verktøy for handel og investering. Enkel registrering, høy transaksjonshastighet og pålitelig beskyttelse av midler gjør Binance til et godt valg for tradere på alle nivåer!
| Navn | Influence on the indicator |
|---|---|
| Volatility | 25% |
| Market volume | 25% |
| Social networks | 15% |
| Surveys | 15% |
| Domination | 10% |
| Trends | 10% |
Volatility
Asset rates are volatile. Beginning investors after making a deal follow the bitcoin chart all their free time. The interest in the price movement is so strong that it keeps you awake.
The value of bitcoin can rise or fall by 10% at any moment.
According to the CEO of Mastercard Inc, Ajay Banga, high volatility scares people. When the price of bitcoin is constantly jumping, it makes investors nervous. To avoid stress, the unpredictable asset is gotten rid of.
When calculating the indicator of fear and greed of cryptocurrency, the current volatility is taken into account in relation to the average parameters for the last 30-90 days. Growth indicates an increase in fear.
Market volume
As the value of BTC increases, its kapitalisering increases. Therefore, the indicator of bitcoin in the fall of 2021 was higher than that of large companies (for example, Tesla). The larger the size of capitalization, the safer the asset is considered to be for investment.
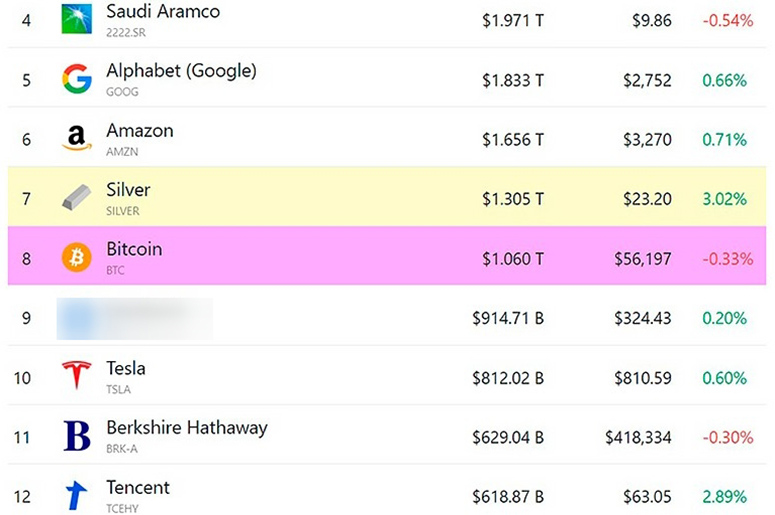
If BTC falls in price by 15%, it will give up its place. This will be noticed by large traders – market volumes strongly influence the desire to sell or buy assets.
Social media
Publications on the topic of bitcoin and cryptocurrencies from opinion leaders and developers appear on Twitter. It is worth paying attention to the number of likes, reposts and comments.
If a person plans to trade bitcoins, it is recommended to subscribe to the social networks of leading developers and investors. At the end of September, Ilon Musk said that cryptocurrency cannot be destroyed. Such opinions increase investor confidence in digital assets.
Surveys
You can determine a promising coin in 2 ways:
- Conduct market research.
- Create a survey.
In the first case, experience and a huge amount of time will be required. New coins appear on the market – by the fall of 2021, more than 7000 cryptocurrencies have been released.
It is much easier to conduct a survey among ordinary users. Both media and celebrities are interested in their opinion.
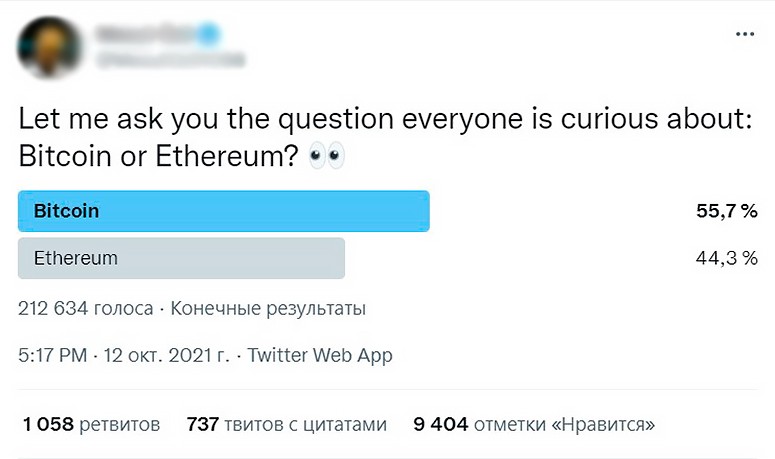
Surveys help to quickly learn the preferences of users. When evaluating the BTC index, investors’ attitudes towards digital coins and individual symboler are taken into account.
Dominance
Bitcoin is the flagship in the cryptocurrency market. It consolidates the bulk of liquidity and influences investors.
To assess the strength of BTC, its capitalization is compared relative to other coins. In October 2021, bitcoin’s dominance was 46%. If this figure falls, investors begin to trust altcoins more. In case of growth, the fear of traders to lose money on dubious tokens increases – market participants transfer capital to BTC.
Trends
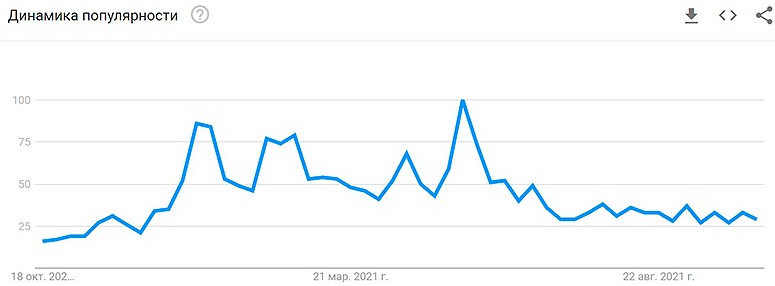
Search engines are used to assess this parameter. With their help, you can determine how actively users are interested in cryptocurrencies. If the number of requests is growing, the level of greed is increasing.
Data accuracy
The fear and greed indicator for Bitcoin is used as an additional tool for analysis. It is a compilation of several parameters that shows the current market situation.
If the index shows extreme fear, it does not guarantee that the price will go down tomorrow.
Market Condition Indicator for 2024
When tracking cycles, history is the best way to help. Newcomers should look at past indicators to understand how they affect the price of digital assets.
Changes over time
The BTC indicator depends on the price movement. Data for one week will help to assess the dynamics.
| Date | Index | Bitcoin rate |
|---|---|---|
| 14.10.2021 | 70 | $57 687 |
| 13.10.2021 | 70 | $57 401 |
| 12.10.2021 | 78 | $56 041 |
| 11.10.2021 | 71 | $57 484 |
| 10.10.2021 | 71 | $54 771 |
| 9.10.2021 | 72 | $54 968 |
| 8.10.2021 | 74 | $53 806 |
Eksempler
To learn how to use the index, we need to understand a few situations:
- Growth amid fear. The indicator showed extreme investor fear on July 20, 2021, when bitcoin was trading at $29,000. The reason turned out to be a prolonged bullish trend. Since mid-April, the value of BTC had been falling. The next day, the trend changed and the rate began to rise rapidly. In 11 days, bitcoin rose in price by $12,000. The indicator itself was still leaning towards fear.
- Falling on the background of greed. The value of bitcoin on May 11, 2021 was $56,704. The indicator at that time showed greed with a level of 61. Despite this, the rate fell to $49,150 the next day, and a little later the index changed to fear.
“Buy when everyone is selling, sell when everyone is buying,” is advice from Warren Buffett.
Trend changes and corrections
The market is characterized by cyclicality. A bearish trend is eventually replaced by a bullish one, and after the ups there is a correction. The indicator will help to distinguish such situations.
What does it say about the change of trend
The indicator will guide you when the price reverses – this happens after a prolonged rise or fall. The longer a certain trend prevails, the higher the probability of its change in the future. The BTC index in this case will show fear in case of a price rise or greed in case of a fall over several days.
What it says about the correction
Ups and downs in price are a frequent phenomenon for cryptocurrencies. The market always reacts the same way to such changes.
After the price decreases by 10%, the rate increases by 1-3%. Most often this happens against the background of the corresponding market mood. For example, when falling, the index continues to show greed – there is a high probability of correction. If the indicator has changed to fear, the price decrease can turn into a trend.
The difference between a correction and a bearish trend
Experienced traders earn even on fluctuations of a few tens of points. If there is a slight drop after a strong price increase, it is recognized as a correction, not a change of trend. The bulls can continue to dominate the market, and the cryptocurrency rate will continue to grow. A correction remains part of the dynamics.
A bearish trend is a gradual decrease in price over a long period of time. Such a phenomenon in the market of digital assets is called “cryptozyme”. The most serious decline occurred between January and December 2018. At that time, the value of BTC fell from $19,666 to $3,252.
Why the uptrend may continue
The movement of value is determined by traders, creating supply and demand. Therefore, investor sentiment plays an important role in predicting the rate.
The most common reasons for further growth are:
- Market conditions. Traders open positions based on technical analysis. If most indicators show an increase in price, investors start buying the coin.
- Sentiment around cryptocurrencies. Digital assets are in the center of attention of regulators, banks and investment funds. If they speak positively about bitcoins and other coins, user confidence in cryptocurrency increases.
- Crisis in other markets. Investors are interested in safe and profitable assets. If the cost of oil or precious metals causes fear among traders, they close positions and look for alternative ways to invest.
Bitcoin Sentiment Index
The first cryptocurrency sets the trend for the whole market. If the value of BTC grows, it will eventually have a positive impact on other coins. In case of a serious fall, almost all other cryptocurrencies start to become cheaper.
Bulls and bears
There is a struggle between 2 driving forces on the exchange. Bulls are trying to capitalize on the growth of the asset by buying it back. Bears are shorting the position, betting on the price decrease.
Their actions can be easily displayed with the help of an index. Bulls show themselves more often when the level of greed increases, and bears become active with the increase of fear.
Where to see the index of BTC
The first cryptocurrency is monitored by many services. You can check the fear and greed level of BTC at:
- BTCTools
- CryptoCurrencyTracker
- Bybt.
How to trade with the help of analysis tools
Finding good moments for a deal is the main principle of successful trading. With the help of the fear and greed index traders can quickly determine the market mood and distinguish a correction from a trend change. However, in order to open a position, it is necessary to analyze:
- The current chart movement.
- Price stack.
- Trading signals from indicators.
Depending on experience, a trader can combine several approaches. To determine support and resistance levels, it is enough to study the depth. If the user is confident that the market will remain flat, you can safely trade in the established range.
Tips and recommendations for analysts
If there are difficulties in the analysis, the trader makes a mistake. Several tips will help to predict the movement with greater accuracy:
- Not only the index. Statistics displays the situation in real time. The rate depends not only on how the chart moved over the last week, month or year. Traders’ decisions are often influenced by news. For successful trading, you have to follow global events that are related to cryptocurrency.
- No to other people’s predictions. Analysts share their opinions, but they can be divided into 2 camps – bulls and bears. The first prophesize a BTC rate of $100,000, and the second say about the imminent fall. Beginners, due to inexperience, prefer convenient forecasts, forgetting to conduct their own analysis of the asset.
- Setting limits. If the user is confident in the forecast, it is not recommended to increase the amount of the transaction. For safe trading, it is better to open a position for 10-20% of the deposit. The main thing is to reduce the risk of capital loss.
- Working schedule. Experienced traders trade at the same time. It becomes easier to notice cyclicality and determine entry points.
- Rest. Trading carries a greater emotional load than office work. Sleep and rest should not be ignored. Cryptocurrency trading is available around the clock, but it is recommended to forget about charts for 1-2 days a week.
Ofte stilte spørsmål
❓ What is the optimal level of fear and greed of crypto?
The index does not have a best value. If it tends to 0, investors are overcome by fear and are ready to sell the asset. If it goes to 100, traders are driven by greed and the desire to buy.
✅ Is it possible to determine the index manually?
This is too labor-intensive a task for one person. As long as he calculates the index based on volatility, social media discussions, volume and other parameters, the value will have already changed.
❗ Is the fear and greed index appropriate for any asset?
The index can be measured for cryptocurrencies, securities, precious metals and so on.
💡 Why is an indicator a bad tool for long-term analysis?
Volatility, volume and trends depend on fundamental events. If advanced countries start banning cryptocurrencies, investor greed will quickly be replaced by fear, and rates are bound to sag.
🔎 How often is the index updated?
The index is recalculated 3 times a day.
En feil i teksten? Marker den med musen og trykk på Ctrl + Skriv inn
Forfatter: Saifedean Ammous, en ekspert på kryptovalutaøkonomi.


