
To make money in the cryptocurrency market, investors and traders use various technical and fundamental analysis tools. For example, the bitcoin dominance index measures the share of digital gold relative to other coins. With the help of this indicator, you can determine the current market trend, predict the beginning or end of the “altcoin season”, and develop an investment strategy. In the article – about where to look and how to apply the chart of bitcoin dominance over altcoins today. Users will also learn what factors affect the change in the indicator.
What is bitcoin dominance
It is the share that BTC occupies in the total capitalization of the industry. Market participants use the Bitcoin dominance index to assess the impact of the main digital asset on the entire cryptocurrency landscape.
A high index indicates that investors are optimistic about the first cryptocurrency. A decrease in BTC dominance could be a signal for altcoin prices to rise and the entire market to move into a bullish phase.
History
Bitcoin was created in 2009 and remained the only cryptocurrency asset for several years. The first altcoin – Litecoin – appeared in 2011.
Since 2013, the mass production of new coins began. But even then, the share of the first cryptocurrency in the market exceeded 90%.
5020 $
bonus for new users!
ByBit provides convenient and safe conditions for cryptocurrency trading, offers low commissions, high level of liquidity and modern tools for market analysis. It supports spot and leveraged trading, and helps beginners and professional traders with an intuitive interface and tutorials.

Earn a 100 $ bonus
for new users!
The largest crypto exchange where you can quickly and safely start your journey in the world of cryptocurrencies. The platform offers hundreds of popular assets, low commissions and advanced tools for trading and investing. Easy registration, high speed of transactions and reliable protection of funds make Binance a great choice for traders of any level!
The situation began to change in 2015 – after the launch of the Ethereum blockchain. In the table you can trace the main stages in the history of BTC dominance.
| Year | BTC share (%) | Comment |
|---|---|---|
How to track
Traders monitor rate changes and the online chart of bitcoin’s dominance over altcoins to make informed trading decisions. Here’s how you can rate these indicators:
- Bitcoin’s rising price and dominance statistically serves as a sign of an uptrend in the main cryptocurrency’s market. At this time, investor capital is flowing into bitcoin.
- A rise in the price and a decrease in BTC dominance may signal the beginning of the “altcoin season”. Investors are ready to consider riskier tokens for investment.
- A decline in price amid the growing dominance of the main crypto asset usually heralds a bearish trend for altcoins. Investors move money into more stable coins.
- With simultaneous price declines and bitcoin dominance, a bearish trend in the cryptocurrency market begins. The period is accompanied by an outflow of capital from all assets.
How to calculate the Bitcoin dominance index
The share of bitcoin in the crypto market can be determined by dividing the capitalization of the asset by the total value of the other coins in circulation. The rates of most digital units repeat the dynamics of the main cryptocurrency. However, the value of the circulating supply of Bitcoin does not grow in direct proportion to the total market capitalization.
The high level of dominance of the flagship indicates that its price increases faster than that of altcoins. Accordingly, the market capitalization of BTC is higher than that of other coins.
The index can be tracked in the largest industry monitors (CoinGecko, CoinMarketCap). These services calculate the bitcoin dominance index in relation to altcoins on the market. At the same time, the number of digital currencies used to determine the total capitalization can vary.
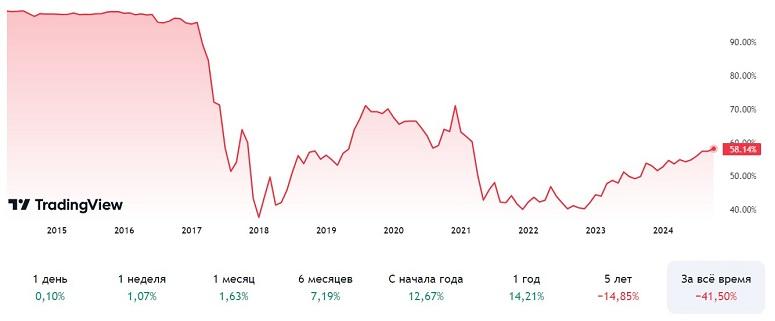
For example, in 2018, Bitcoin’s share was 32% among just over 1,000 coins. At the time of writing, the flagship dominates the market with 54.4%. The total altcoin capitalization is calculated based on data from 14.75 thousand coins. This means that there are 14.7 times more assets that are included in the index, and the share of the flagship has increased by 22.4%.
Factors contributing to bitcoin’s dominance
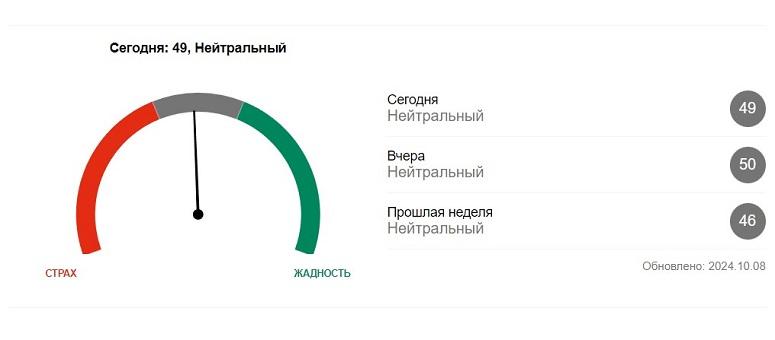
The share of the flagship asset in the total crypto market capitalization is the baseline indicator that is used to calculate other popular metrics. For example, the Fear and Greed Index tracks investor and trader sentiment between 0 and 100.
The BTC Domination Index changes due to a number of factors. Among them:
- The bitcoin exchange rate. A rise in price means a large inflow of investment. Accordingly, the market capitalization increases, and thus the dominance of the asset. When the exchange rate decreases, the opposite happens.
- Financial performance of altcoins. When investors’ capitals flow into riskier assets, the dominance of the flagship decreases, and vice versa.
- Market sentiment. During periods of uncertainty or high volatility, investors move money into the more stable asset, bitcoin. This reinforces the dominance of the main cryptocurrency.
- Regulators’ decisions. If a popular coin faces control problems from the authorities, investors may transfer money to Bitcoin.
- Launch of new projects. The expansion of the altcoin sector weakens Bitcoin’s dominance.
- Market speculation. When traders move funds between assets for short-term profits, the dominance index changes quickly.
- Asset availability. BTC is the largest and most liquid coin. Investors are more likely to choose the flagship asset, which strengthens its position in the market.
How BTC’s dominance affects other cryptocurrencies
The flagship asset has a large market share, so it sets the direction for many digital coins. It has been observed: the higher the dominance of BTC, the stronger the largest forks – for example, LTC and Zcash – begin to grow. Investor interest in these digital currencies increases.
But the correlation of Bitcoin with other coins is not always obvious. For example, PoS cryptocurrencies can strategically lose value when Bitcoin rises. These assets often start to rise in price when the dominance of the flagship coin increases. In the table, you can compare the current correlation between the largest digital currencies.
| Assets | Bitcoin | Ethereum | Ripple | Litecoin | Bitcoin Cash | Dogecoin |
|---|---|---|---|---|---|---|
How to use bitcoin dominance in trading
Crypto market participants work with the indicator when they need to assess the current state of the industry or determine a trading strategy. The main actions when the dominance changes in either direction:
- Trend analysis and reallocation of positions.
- Portfolio diversification.
Index growth
When Bitcoin’s market share increases, it may indicate that investors are shifting money from riskier coins to a relatively stable asset. By analyzing trends, traders strengthen positions in bitcoin and, accordingly, reduce risks in altcoins.
Another situation occurs when the price of the flagship crypto asset falls and dominance grows. This means that alternative currencies appreciate faster. The high probability of the trend changing to a bearish one makes traders hold on to Bitcoin and sell other coins.
Decline in the index
If the dominance (BTC.D index) and the price of the flagship cryptocurrency fall, the market becomes bearish. In such a situation, traders withdraw funds or buy Bitcoin on the decline.
The onset of the bullish phase is indicated by a decrease in the share of the cryptoasset in the total capitalization with a simultaneous increase in price. In this case, it is recommended to buy altcoins – they statistically grow faster and can bring higher income.
Also, when the dominance weakens, it is worth redistributing capital across several crypto coins. To diversify your portfolio, you can choose digital currencies with a better capitalization-to-total ratio.
Tips for using the BTC.D index in investing
An indicator value above 50% means that the market capitalization of bitcoin prevails over this parameter in other coins. In such a situation:
- During an uptrend, BTC grows faster than altcoins.
- In a falling market, the latter correct more strongly.
When the dominance decreases, the situation is the opposite. The flagship digital currency falls faster during a downtrend, while altcoins grow better in an uptrend. Realizing this, investors can use the Bitcoin dominance chart to rebalance their portfolio according to the current situation.
It is also necessary to understand the cycles and structure of the crypto market. You need to use technical analysis tools to determine which assets to invest in.
What is the importance of the BTC Dominance Index for traders
The indicator helps to understand the sentiment of crypto market participants and assess the relationship between the main digital currency and the rest of the coins. The tool allows traders to manage risks more effectively, as well as get more accurate information about price movements and shifting trends. By understanding the current market situation, future directions can be predicted.
Advantages and disadvantages of the BTC.D indicator
The Bitcoin Dominance Index is a basic tool for analyzing the crypto market. By tracking changes in the share of the flagship asset, traders can make informed decisions on transactions. In combination with other technical analysis tools, BTC.D will give a more accurate picture of future price movements.
The disadvantages of the indicator are related to inaccuracies in the measurement of capitalization. The number of crypto coins is constantly growing. Many of them disappear almost immediately after launch. In addition, analysts differently determine the share of Bitcoin in the industry. Some suggest removing stablecoins from the calculation, while others include only digital currencies from the top 100 by capitalization in the index.
Frequent questions
💵 What is the “real” bitcoin dominance index?
It is the ratio of BTC capitalization to the overall PoW coin valuation. The logic is that PoS tokens cannot compete with bitcoin. Proof-of-Work is the only mechanism that allows decentralization.
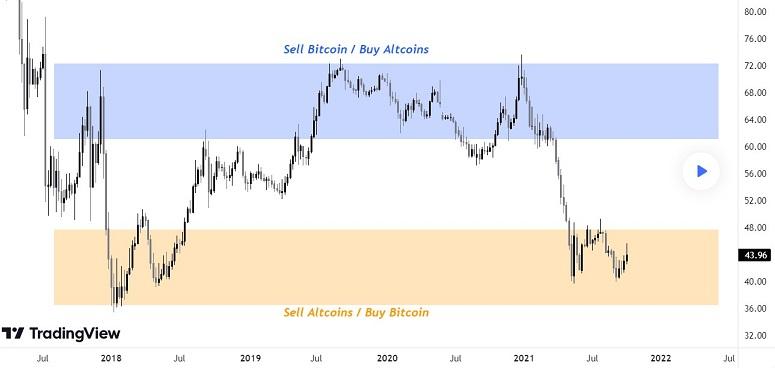
📊 What index levels are considered extreme high and low?
These are levels of 75% and 35%. The levels were observed between 2017 and 2021 respectively. It is believed that when the historical maximum of dominance is reached, we can expect the digital currency to decline.
💰 What is proportional balancing of crypto assets in a portfolio?
It is believed that the dominance indicator can be applied to any digital currency. Based on this principle, crypto investors allocate funds to the coins with the best performance.
✅ How to use DCA bots when Bitcoin’s dominance decreases?
Traders interested in accumulating crypto assets are setting up robots to buy.
📈 What is “altcoin season”?
This is the name given to the period when digital currency rates rise faster than Bitcoin prices.
Is there a mistake in the text? Highlight it with your mouse and press Ctrl + Enter
Author: Saifedean Ammous, an expert in cryptocurrency economics.


