
The exchange rate of most digital assets is constantly changing. This market volatility allows traders to make money on speculation. To predict further movements of quotes, technical analysis methods are used. Its essence is to study the chart and search for patterns in cryptocurrencies. They help the trader to see signs of trend continuation or reversal. This skill is considered basic for trading on the market of digital assets.
The concept of patterns in cryptocurrency
Technical analysis is a method of chart research that allows you to predict short-term rate movements. It is based on the search for patterns, the study of support, resistance levels and other tools (indicators, oscillators). They do not guarantee absolute accuracy in forecasts. But they give an idea of the most probable scenarios of chart movements.
To make money on speculations, it is enough to make more than half of correct forecasts. Therefore, a good indicator for traders is 60-70%.
Patterns in cryptocurrency trading – figures on the rate chart, signaling the continuation or reversal of the trend. There are many of them, but for forecasting it is enough to know the most common ones.
The main patterns on the charts of cryptocurrencies
The task of speculators is to predict the movement of quotes. In many ways, they are helped by graphical patterns. They indicate the continuation of the global trend or its reversal. At the same time, some figures can signal both (for example, a wedge). Everything depends on the previous market trend. The table shows what some patterns indicate.
| Pattern | Continuation | Pivot |
|---|---|---|
Trend continuation
It is believed that financial markets are cyclical and situations in them repeat themselves. This is the basis for the idea of technical analysis. Each pattern on the chart is a figure that has led to repeated outcomes in the past. Continued rise or fall in cryptocurrency prices is indicated by:
5020 $
bonus for new users!
ByBit provides convenient and safe conditions for cryptocurrency trading, offers low commissions, high level of liquidity and modern tools for market analysis. It supports spot and leveraged trading, and helps beginners and professional traders with an intuitive interface and tutorials.
Earn a 100 $ bonus
for new users!
The largest crypto exchange where you can quickly and safely start your journey in the world of cryptocurrencies. The platform offers hundreds of popular assets, low commissions and advanced tools for trading and investing. Easy registration, high speed of transactions and reliable protection of funds make Binance a great choice for traders of any level!
- Triangles
- Wedge
- Flag
- Rectangle.
Triangles
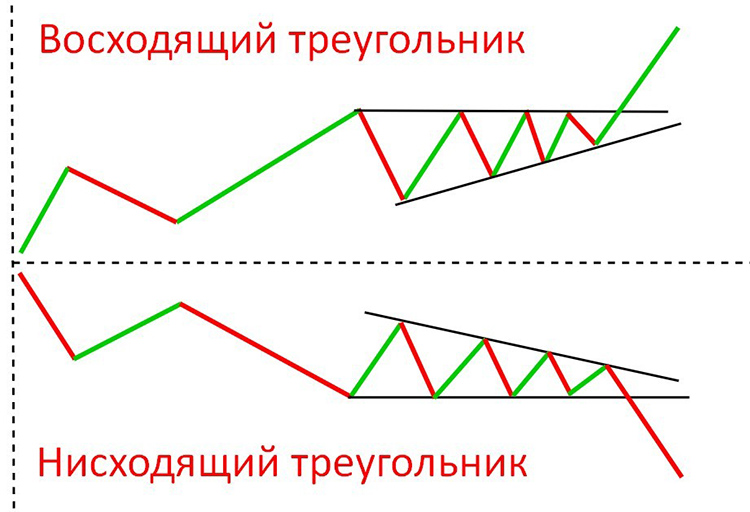
This graphical figure is considered a reliable indicator of further movement of quotes. Basically, triangles are divided into 2 types:
- Ascending. They are formed when the buyers of the asset (bulls) rest at the resistance line. In this case, their strength exceeds the sellers (bears). These triangles lead to the breakdown of the resistance level with the continuation of the rate growth.
- Downtrends. Opposite figures that work in reverse order. When they are formed, most likely, the quotes will continue to fall.
There is also a symmetrical triangle. It is more rare. Such a pattern implies that the forces of buyers and sellers are equal. It is impossible to predict the exit of the rate from this figure.
Wedge
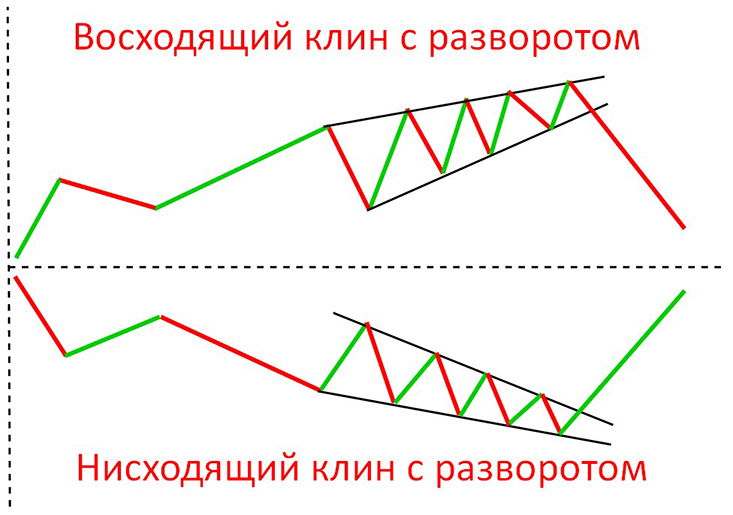
This pattern visually resembles a triangle, but the chart narrows up or down. It is formed at the moment of trading volume decrease, when speculators are in a position of uncertainty. More often the pattern indicates a trend reversal. However, in some cases it indicates its continuation. Wedges are also of 2 types:
- Uptrending. They signal a decrease in purchasing power. The outcome of these wedges is a reversal in the direction of the rate decline. However, an ascending pattern can be formed in a bear market, and this indicates a continuation of the trend.
- Downtrends. These graphical figures are similar to the previous ones. If such a wedge appears in a falling market, a reversal is more likely to occur. But when the rate is growing, it indicates the continuation of the trend.
When trading on the “wedge” pattern, you should take into account the duration of its formation. The longer the figure was drawn, the more reliable it works.
Flag
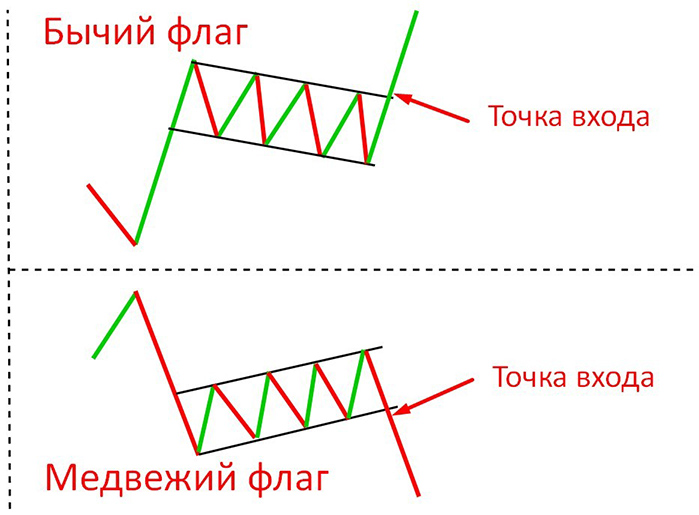
This figure indicates the continuation of the trend. It is formed after a sharp rise or fall of the rate. At this point, the chart enters the consolidation stage – accumulation of assets. Often further there is a breakthrough of the formed level in the direction of continuation of growth or fall in price. Flags are divided into:
- Bullish. They speak about further price increase.
- Bearish. They indicate a decrease in price.
More often traders open a position when a trend line is broken. This serves as a signal of a worked flag.
Rectangle
Outwardly, it resembles a flag pattern. However, the consolidation corridor is formed by a straight line. This graphical figure indicates the continuation of the trend. Rectangles can be bullish and bearish. Both variations work similarly to the flag. But there is a nuance. The rectangle will work if the trend has not changed for the last 2 weeks. Exit from the consolidation corridor is accompanied by a sharp increase in trading volume.
Sometimes the rectangle figure indicates a trend reversal. This happens if the growth or fall of the rate lasted at least 1 month.
Trend reversal
There are also patterns on the charts of cryptocurrencies, which often indicate a change in the movement of the course. The main ones are:
- Head and shoulders.
- Double top.
Head and shoulders
This graphical figure is considered a reversal. More often it is drawn after breaking through the resistance level. It is called the neck. When forming the head and shoulders, the rate returns to the support line 3 times. And 3 tops appear on the chart, where the extreme ones are much smaller than the average. That is why the pattern has such a name.
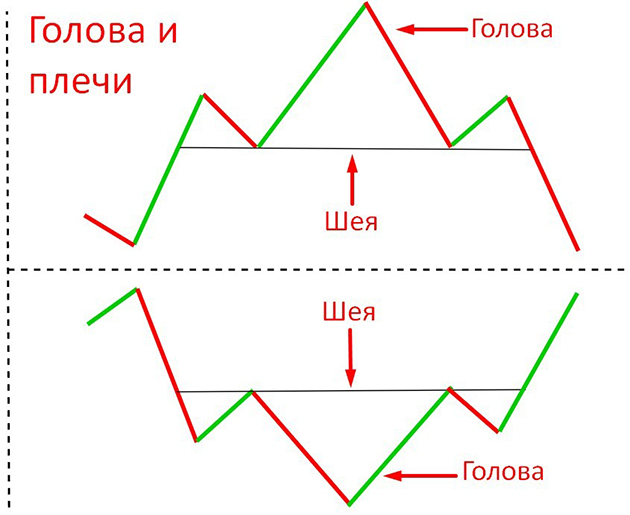
Trading on this pattern should be done with caution. Sometimes it turns out to be false. Therefore, traders open orders after breaking through the key level – the neck. At the stage of completion of the figure, the trading volume increases more often.
Double top
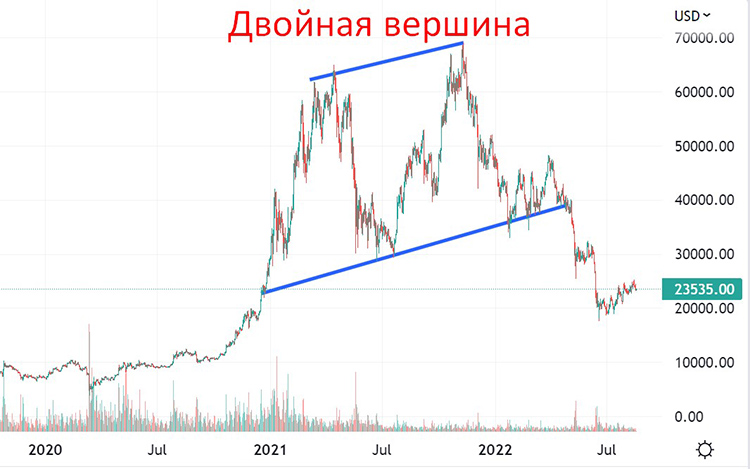
Another reversal pattern for cryptocurrencies. It worked during the growth of Bitcoin in 2021. The pattern is formed during a period of high market volatility. It consists of 2 roughly equal peaks with a depression in the middle. Its reliability depends on the duration of formation. If the double top appeared on the daily chart, it will work with a higher probability than on the 15-minute timeframe.
Effectiveness of patterns in predicting the rate trend in 2024
Trading on chart patterns has a disadvantage – they do not work in certain market conditions. Therefore, investors apply fundamental analysis methods when forecasting the exchange rate. It is a study of internal and external factors that affect the market or individual blockchain projects.
Basically, fundamental analysis is based on news.
For example, on July 27, 2022, the head of the Fed (Federal Reserve) in the United States announced an interest rate hike of 75 points. After that, the cryptocurrency market began to grow. A day later, the capitalization of the industry increased by 10.27%. In this situation, predicting the movement of rates by patterns is useless.
It is possible to use technical analysis for short-term trading. However, you need to follow 3 rules:
- Do not trade during high volatility. More often in these conditions, cryptocurrency rates behave unpredictably.
- Take into account the timeframe. Figures on the chart work better if they have been formed for a long time.
- Take into account the news background. When trading, it is necessary to carry out fundamental analysis of the market. Together with the use of patterns it will give results.
Other tools for thechanalysis of cryptocurrencies
Patterns are drawings on the chart, which indicate the further movement of the rate. But, in addition to them, indicators are used in technical analysis. This is the result of mathematical calculations displayed on the chart. Indicators show trend strength, probability of reversal and other metrics. They help speculators in making predictions.
The main indicators of thechanalysis:
- MACD (Moving Average Convergence Divergence). This indicator shows the momentum of the rate movement. An example of a situation: the price of bitcoin is rising, but MACD indicates a weak bulls’ strength. In this case, a trend reversal is likely to occur soon.
- MA (Moving Average). Moving averages smooth out short-term rate hikes and determine the general trend in the cryptocurrency market (growth or decline). Traders more often use the 200-day MA. If the chart of a digital asset is above it, it means that the trend is positive. In another case, the cryptocurrency is in a falling stage. But traders combine the 100-day MA with it. Using these 2 moving averages, speculators wait for the moment to buy or sell assets. If the 100-day MA grows and crosses the 200-day MA, it indicates a buy signal. This situation in the market is called a golden cross.
- RSI (Relative Strength Index). It is translated as “Relative Strength Index”. The indicator shows the impulse of price movement. If it rises from 70 to 100 points during the growth of an asset, it means that the purchasing power remains at a high level.
- BB (Bollinger Bands). Bollinger lines display the volatility of the market. The indicator consists of lower, middle and upper levels. It is used by traders to determine whether an asset is overbought or oversold. If the price of cryptocurrency is close to the lower boundary of the indicator, it means that bears are getting weaker. This indicates a reversal of the chart in the direction of appreciation of the coin. And, accordingly, vice versa.
Conclusions
Trading on the cryptocurrency exchange is a complex activity. When making predictions, you need to take into account many nuances: fundamental factors, resistance and support levels, technical indicators, as well as drawings on the chart. Using all this, a trader is able to predict the future behavior of the crypto market with an accuracy of 60-80%. This is enough to make money on exchange trading.
There are no financial recommendations in the article. Trading is a risky activity, the responsibility for which everyone is responsible for himself.
Frequent questions from users
🚩 What is a “death cross”?
It is a situation when the 100-day MA falls below the 200-day MA. The figure signals a further decline in the crypto market. However, in certain cases, the “death cross” turns out to be false.
😎 What kind of character do I need to have for trading on the exchange?
The main thing is cold-bloodedness. A speculator must soberly evaluate market situations and follow the trading strategy.
❔ What is scalping?
It is a type of short-term trading, when a speculator makes many deals in a small period of time. He is able to open hundreds of orders in 1 session.
👀 What is a support level?
It is a line on the chart, at which there are many pending orders to buy an asset. A price bounce from the support level serves as an entry point for traders.
💵 What is the difference between trading and investing?
Traders on the stock exchange speculate on changes in quotes. And investors invest money in the long term with the certainty of the future success of the project.
Is there a mistake in the text? Highlight it with your mouse and press Ctrl + Enter
Author: Saifedean Ammous, an expert in cryptocurrency economics.


