To trade digital assets, you need to understand how the market works. Coin prices change under the influence of various factors. The trader’s task is to predict the future direction and open a potentially profitable transaction. For this purpose, technical and fundamental analysis tools are used. There is another, relatively new methodology. Cryptocurrency onchain analysis explains the behavior of market participants and allows you to predict the growth or fall of rates using blockchain data. The method relies on indicator readings that establish a link between changes in network states and coin prices.
What is cryptocurrency onchain analysis
Financial markets do not operate in a chaotic manner. They have patterns in them, using which investors can predict future price changes using technical and fundamental analysis. These tools are also applicable in the digital market.
However, unlike traditional assets, cryptocurrencies exist only in the blockchain. So, you need to consider them in this environment as well. For this purpose, onchain analysis is used. The methodology examines the state of the network, its components and metrics – wallets, transactions, commissions. By tracking changes in the blockchain, it is possible to assume the movement of coin rates.
Why use it
Onchain analysis refers to an enhanced approach to digital currency trading and market research. It can be used to get more accurate data on assets. The onchain analysis works especially effectively in conjunction with other technical and fundamental tools.
For example, the HODL Waves indicator divides wallets registered in the network into groups based on activity and monitors the change in the share of each of them for a specific period. With its help, you can determine the age of coins and, accordingly, the percentage of hodlers and short-term holders of the asset.
According to statistics, an increase in the number of the former serves as a sign of future growth. But you need to consider the cryptocurrency’s fundamentals as well. Investors may hold tokens under the terms of vesting, and not with the expectation of future growth.
5020 $
bonus for new users!
ByBit provides convenient and safe conditions for cryptocurrency trading, offers low commissions, high level of liquidity and modern tools for market analysis. It supports spot and leveraged trading, and helps beginners and professional traders with an intuitive interface and tutorials.
Earn a 100 $ bonus
for new users!
Крупнейшая криптобиржа, где можно быстро и безопасно начать путь в мире криптовалют. Платформа предлагает сотни популярных активов, низкие комиссии и продвинутые инструменты для торговли и инвестиций. Простая регистрация, высокая скорость операций и надежная защита средств делают Binance отличным выбором для трейдеров любого уровня!
How to use onchain analysis
Trading digital currencies involves high risks. Researching network activity reduces uncertainty and increases the number of profitable trades.
For example, by tracking the concentration of cryptocurrency, a trader can determine the ratio of large investors (“whales”) to ordinary holders (“hamsters”). The activation of the former indicates the beginning of an uptrend. The prevalence of “hamsters” is a sign that the asset is overbought.
Another popular indicator is the number of new wallets in the network. It should be considered together with the speed of creating addresses. Together, these data can indicate an increased interest in the asset, but they are interpreted differently.
In order not to be mistaken with the conclusions, you need to conduct a technical analysis of the cryptocurrency. If the excitement is not supported by large cash injections into the asset, it may indicate overbought and a rapid reversal of the trend.
Varieties of onchain indicators
Many markers characterize the state of the blockchain. For a simple analysis, you can track the activity of the largest wallets. In combination with technical and fundamental data, this will allow you to predict price movements and changes in trends.
To conduct a large-scale study, you can apply special indicators. There are many of them, since serious cryptocurrency projects differ in their fundamentals. But it is possible to highlight common metrics that are used in onchain trading most often.
NVT Ratio
Network Value to Transactions Ratio determines the ratio of capitalization to the volume of transactions in the network. A high result demonstrates an overbought asset, while a low result demonstrates oversold.
The indicator was developed by Placeholder Venture Fund partner Chris Berniske together with user Willy Woo. NVT Ratio is a cryptocurrency analog of the P/E Ratio, which is used in the traditional market to analyze the real value of stocks. In its classic form, the tool measures market capitalization to a company’s annual earnings.
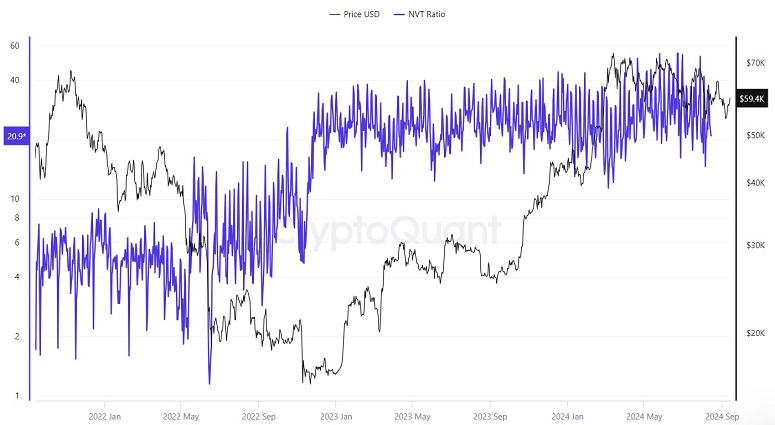
The indicator looks like a line showing the fair value of the cryptocurrency for a specific period. Ideally, the market price of the asset tends to match it. If a significant difference is seen when overlaying the charts, it indicates that the exchange rate is unstable. In the case of an overbought asset, a rapid correction can be expected. If the data shows that the asset is oversold, the price will rise.
MVRV Ratio
The indicator helps to detect price highs and lows on the cryptocurrency chart. Traders use this information to establish cycles (accumulation and distribution) and long-term trends.
Market Cap versus Realized Cap is defined as the ratio of market capitalization to realized capitalization (calculated at the current moment). The data is updated in real time.
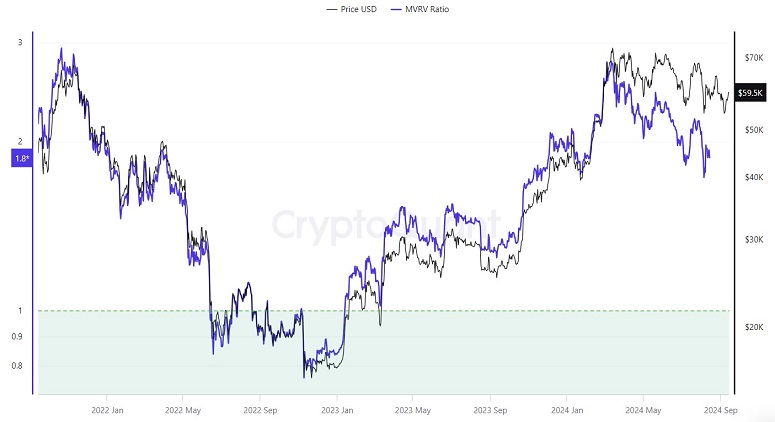
If the ratio is below 1, it means speculators dominate over long-term investors. Its being in this position for a long period indicates accumulation in the market.
Number of active addresses
The indicator demonstrates the demand for digital currency and the involvement of users in the network. A large number of active addresses indicates the popularity of the blockchain (and vice versa). The indicator can be tracked in network browsers.
A similar indicator AASI (Active Address Sentiment Indicator) has a narrower specification – it assesses the proportion of addresses accepting and sending cryptocurrency.
A result below 1 indicates the prevalence of sales and pessimistic mood of investors, above 1 – indicates purchases and accumulation of the asset.
Hashrate
Onchain metrics are used only for coins on the Proof-of-Work algorithm. The hashrate of the network demonstrates the total computing power of the machinery connected to the mining of digital currency. A high indicator shows the decentralization of the asset. It also indicates the popularity of the coin among miners.
You can track the network hash rate in monitoring. For example, Mining Pool Stats shows real-time changes and mining statistics for the last 24 hours.
Bitcoin inflow to exchanges
Large inflows of cryptocurrency to trading platforms statistically precede sell-offs. The outflow of funds, on the contrary, indicates the intention of investors to hold the asset and, according to observations, entails a rise in price.
You can track the dynamics on Glassnode, Coin Metrics and other websites. For example, in September 2024, analysts recorded a decrease in the total inflow of BTC to centralized crypto exchanges.
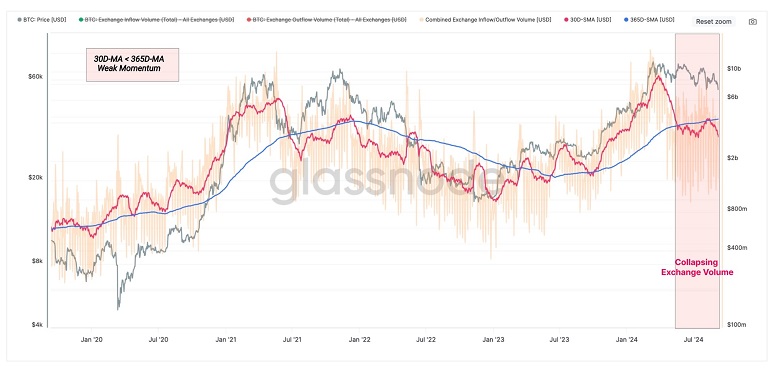
At this time, the cryptocurrency’s exchange rate began to recover after the recent decline. By mid-September, Bitcoin returned to the $57 thousand mark.
Pewell Multiplier
The metric is used to determine the buying and selling points of bitcoin. The result is calculated as a ratio of the number of coins mined in 24 hours to the value of the 365-day moving average.
The indicator was developed by blockchain analyst David Pewell in 2019. He suggested that cycles in the crypto market are formed by miners. The latter are forced to look for the best entry points to recover the costs of mining coins.
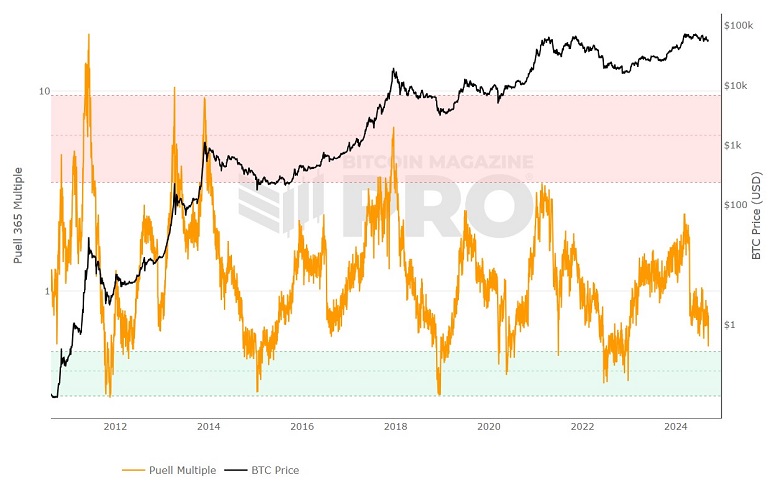
On the graph, you can see 2 border zones. Crossing the curve with the upper one allows you to find points for selling the asset, the lower one – for buying.
Total Value Locked
This is an indicator of the total value locked. TVL determines how much cryptocurrency is contained in smart contracts or dApps in a particular period. The indicator is used to evaluate blockchain networks, individual protocols and applications.
A high volume of blockchain funds indicates the popularity of the platform.
TVL can be evaluated in dynamics and in relation to other projects. The indicator is tracked on DefiLlama and alternative platforms.
Exchange Reserve
The metric allows estimating the volume of a particular digital asset on exchanges. Based on Exchange Reserve, investors can guess how much cryptocurrency will potentially be sold. The more coins are on exchanges, the higher the risk of a decline in the exchange rate. The opposite statement is also true. A decrease in volume indicates a future price increase.
According to CryptoQuant, in September 2024, the total bitcoin reserve on centralized exchanges reached its lowest level in 2 years – $2.67 million. Analysts see this as a sign of the upcoming bullrun.
Popular cryptocurrency onchain analytics platforms
Exploring the blockchain for profitable digital coin trades is a young technique. However, it complements technical and fundamental analysis of cryptocurrencies well. There are several major platforms online that provide basic and specific indicators for onchain research.
Arbitrage Scanner
The platform provides cryptocurrency onchain analytics and coin arbitrage scanner. Arbitrage Scanner functionality includes:
- Onchain analysis of crypto wallets by filters. Finding similar vaults using artificial intelligence.
- Arbitrage Scanner between CEX and DEX crypto exchanges. More than 40 platforms with spot and futures markets are supported.
- Track market information and news before it is released to the media.
You must register on the site and subscribe to receive information. A trial one costs $69 per month. Newcomers are offered a scanner on over 15 CEX with flexible customization, advanced wallet analysis, filter search and metrics on 5 selected blockchains.
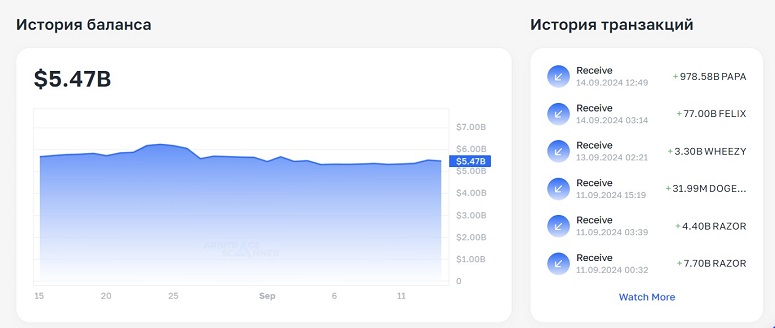
NFT and Message services are also available as part of the test plan. Regardless of subscription level, users can participate in closed customer training webinars and contact tech support 24/7.
Glassnode
The popular Swiss platform provides a wealth of data for comprehensive network analysis of cryptocurrencies. The set of tools is constantly being updated. Glassnode analysts develop and implement proprietary metrics that facilitate investment and trading of digital assets.
Users are offered 3 levels of access. More details about them – in the table.
| Level | Cost | Features |
|---|---|---|
CryptoQuant
South Korean platform tracks the performance of major cryptocurrency networks. It prioritizes the analysis of Bitcoin, Ethereum, and stablecoins.
CryptoQuant offers a large number of indicators for traders and investors. Basic metrics are available for free. To get advanced network data, you need a subscription. Paid plans start at $29 per month. A Premium subscription costs $799.
Fighting financial crime with onchain
Comprehensive analysis of the blockchain helps to conduct successful cryptocurrency transactions. However, its functions are not limited to that. With the help of onchain tools, it is possible to detect and prevent cybercrime.
For example, companies accepting cryptocurrency payments use AML filters. Special algorithms check the history of transfers, identifying links to suspicious and criminal services. This is possible due to the openness of the blockchain.
As a rule, exchanges, exchangers, and P2P platforms do not have their own AML algorithms. They use specialized services such as Crystal and Chainalysis. Criminals can be identified using KYC.
How onchain differs from offchain
Essentially, these are 2 different technologies that offer the necessary tools to work with cryptocurrencies. Onchain transactions take place within the network and are recorded in the blockchain. Ofchain transactions are performed by third-party services or second-tier platforms, and the result is recorded in a register.
There are no intermediaries in onchain transactions, so they are safer. However, users will have to pay commissions to miners (validators). In off-network transactions, fees are minimal and settlement speed is faster. In blockchain, there are long delays due to the accumulation of transfers waiting to be processed.
Frequently Asked Questions
⚡ What are some other onchain indicators?
There are many analytical tools. For example, Spent Output Profit Ratio (SOPR) shows whether assets are sold at a profit or loss at a particular moment.
✨ What is inter-exchange arbitrage of cryptocurrencies?
It is making money from the difference in coin rates between exchanges. You can buy a crypto asset on one platform for a lower price and sell it on the second with a profit.
🔎 What are moving averages on a cryptoasset chart?
They are additional lines that repeat the movement of the rate with a small lag. Moving averages (MA) show trends, act as support and resistance levels.
📌 What is a sidechain?
It is a blockchain add-on designed to offload the main network. In a sidechain, calculations are performed and the result is written to the main ledger.
🔔 Can I trade on only onchain metrics?
No. Onchain metrics work well as a complement to technical and fundamental analysis. You can’t interpret metrics correctly out of context.
A mistake in the text? Highlight it with your mouse and press Ctrl + Enter
Author: Saifedean Ammous, an expert in cryptocurrency economics.


