
The cryptocurrency market is characterized by volatility and unpredictability. Technical analysis is one of the most popular methods of assessing its state. Traders use a number of services to formulate strategies. The chart of bitcoin to the dollar by the Ishimoku cloud indicator gives an idea of potential support and resistance levels, dynamics and trends. This system is referred to as an “all-in-one” system.
Ishimoku Cloud Indicator
The system was developed by Goichi Hosoda, a Japanese analyst. He spent 30 years perfecting the technique before he published his results in the late 1960s.
It is one of the commonly used methods of analysis. It can be described as a combination of several functions on a single chart. Because of the separation of components into periods, traders identify short-, medium- and long-term movements. The tool predicts value and highlights cryptocurrency price trends over a set period of time, erasing random fluctuations.
What it looks like
The tool reports up-to-date information about the movement of the coin. It consists of five lines. Two of them form a space called a cloud.
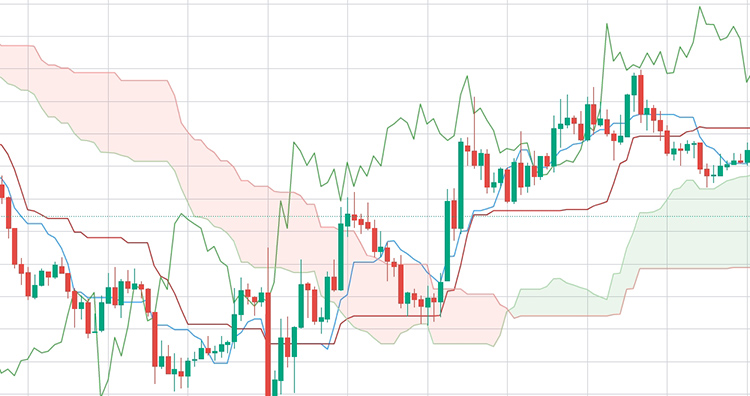
Despite its universality, the abundance of lines distracts traders from actually analyzing price movements, candlesticks, pattern formation. Finding signals quickly requires a lot of practice and patience.
To avoid conflating prices with Ishimoku lines, the tool is applied mainly to candlestick chart or bars. Linear with the indicator is almost never used.
5020 $
bonus for new users!
ByBit provides convenient and safe conditions for cryptocurrency trading, offers low commissions, high level of liquidity and modern tools for market analysis. It supports spot and leveraged trading, and helps beginners and professional traders with an intuitive interface and tutorials.
Earn a 100 $ bonus
for new users!
The largest crypto exchange where you can quickly and safely start your journey in the world of cryptocurrencies. The platform offers hundreds of popular assets, low commissions and advanced tools for trading and investing. Easy registration, high speed of transactions and reliable protection of funds make Binance a great choice for traders of any level!
Each Ishimoku element denotes the mood of the market. In certain circumstances, they signal a buy, sell or change in direction. You can see from the Ishimoku:
- Price momentum (intensity of fluctuations).
- Support and resistance zones.
- Trend.
- Volatility.
- Potential reversals.
Principle of operation
The system takes into account time and price trend. The lines are a variation of moving averages. However, instead of using the closing price, they are built from the smoothed value of extrema for a specific period of time. The Ishimoku cloud indicator is used for the following purposes:
- Determining trend movement in the market.
- Searching, displaying current and potential support and resistance levels.
- Identification of stop loss and take profit points.
Like the Bollinger Band, the Ishimoku shows market volatility. A wide and deep cloud means large price swings and less certainty of future direction. While a narrow and flat cloud indicates a stable market.
Time intervals
Ishimoku tools are based on a market with a specific time frame. Therefore, the creator Goichi Hosoda set the periods:
- 9 – denotes a week and a half of trading.
- 26 – equals the number of days in a month (30 minus four Sundays).
- 52 – equals two months.
For example, Kijun-sen represents a 26-period moving average by default. This means that its performance is based on the high and low prices of the last 26 candles.
The tool was originally designed for the Asian session with smoother and longer price movements without sudden price spikes. Since the cryptocurrency market is particularly volatile, the signals lose accuracy during intraday trading. However, traders use the system for different timeframes, changing the initial configurations.
Signal lines
For accurate and fast trading, traders observe the behavior of the Ishimoku elements. Each represents a specific aspect of price action:
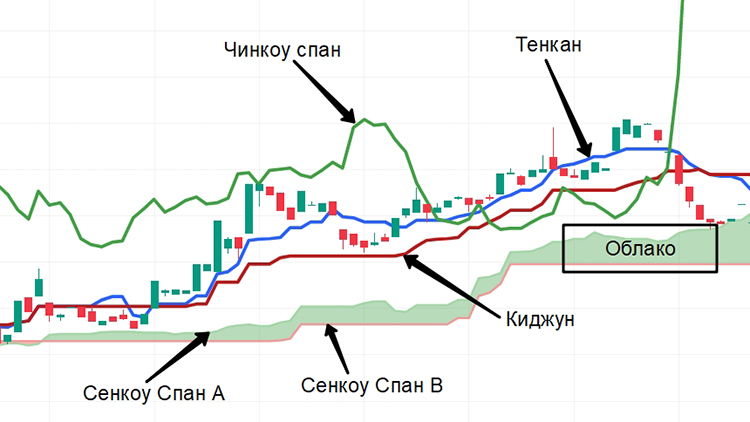
- Tenkan-sen (TS). The element is called a conversion line. It is marked in blue on the chart. It denotes the arithmetic average of price highs and lows. A 9-day period is set by default.
- Kijun-sen (KS). This is the red base line, the main market reference point. It is calculated by the average value of extrema. The interval is 26 days.
- Chikou Span (CS). A green (sometimes brown) lagging band. Displays the closing price of the current candle with a specified delay and indicates the trend. The time interval is set to 52 days.
Two more lines are drawn: Senkou span A (SSA) (derived from the Tenkan and Kijun) and Senkou span B (SSB) (derived from the maximum and minimum of this period). The space between them is the cloud itself (Kumo). This is the main component of the indicator.
Ishimoku Cloud Kumo
This tool is formed from two lines – SSA and SSB. Kumo indicates support and resistance levels, taking into account the price dynamics of previous periods. In a strong bullish signal everything happens above the cloud, in a bearish signal – below. Trading inside is an indicator of consolidation.
It is not recommended to participate in trading while the price is sideways. Ishimoku can give false signals, there is a probability of capital loss.
The main component is divided into large zones. They are colored green and red and indicate either an uptrend or a downtrend. Kumo belongs to the so-called “leading indicators”. On the chart, you can notice that the instrument is located outside the price.
Indicator settings for cryptocurrency trading
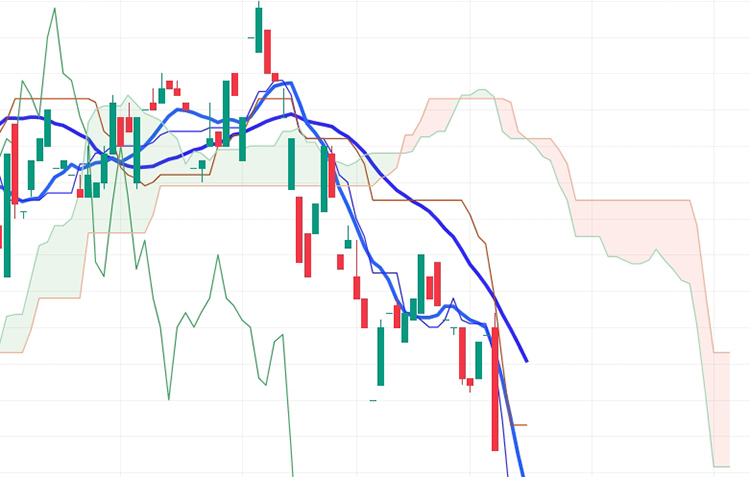
Since the market of digital currencies operates 24/7, professional traders suggest increasing the standard parameters. This is done to prevent incorrect entry or exit signals. The Ishimoku cloud indicator settings are as follows:
- 7 + 3 (due to low volume on Sunday) = 10.
- 30 days in a month.
- 2 months of cryptocurrency trading = 60 days.
There are also other configurations. They are used depending on which timeframe the trading is taking place. Highlighted are:
- 2-24-120. Suitable for five-minute intervals and can be used in scalping.
- 20-60-120. This setting is chosen to filter out false signals. The parameter is best combined with coins that have a large amount of trading data.
- 120-240-480. For strategies designed for one or several days.
Cryptocurrency market participants have different attitudes to the deviation from the standard 9-26-52. Some consider it convenient and even necessary. Others note that the amendments introduce false signals.
Traders determine their strategy by constant trading.
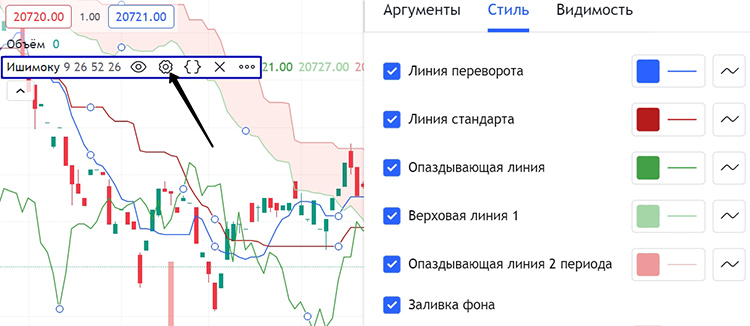
Each chart changes the settings for the color of the lines and the way they are displayed (solid, dotted, thick, thin). Kumo can also be edited.
How to trade on the indicator
Ishimoku is a tool that traders use to build a complete strategy. It provides all three types of signals: preliminary, main and confirming. Trading on this system allows you to determine which one is bullish and which one is bearish.
Analyzing the price chart
The Ishimoku cloud indicator is used both in rising and falling markets. But during consolidation, the tool loses its power. The chart is analyzed in the following way:
- First of all, traders pay attention to Kumo. This is the most important aspect of the system, which helps to determine the trend in relation to the past price movement and find entries into the transaction.
- Then you can consider the location of the bands. If the candles are above the cloud and the Tenkan crosses the Kijun from the bottom to the top, these are signs of a buy signal.
- The trailing line helps to confirm a potential move. It breaks above the Kumo in an uptrend, or falls over the edge to the downside in a downtrend.
Support and resistance levels
Trading system elements work for more than just creating strategies. They can be used to identify key price areas.
The Tenkan and Kijun act as dynamic support if the movement remains above the lines. If the candles are lower, you can expect the bands to become resistance during any upward spike.
But more often market participants focus on Kumo. It gives an idea of the future trend. Breakout of the levels and consolidation of the candlesticks indicate a strong bullish or bearish movement.
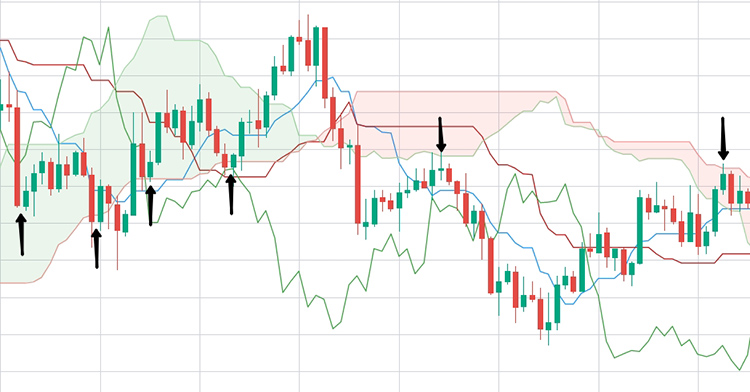
Trading on the Ishimoku cloud indicator on the BTC/USD chart example
The tool may look complicated and confusing due to the large number of lines and areas displayed. However, things become easier if you understand the basic types of strategies.
For example, on October 25, 2022, Bitcoin rose by ~4%. If you analyze the chart, you can see several signals for potential price movement.
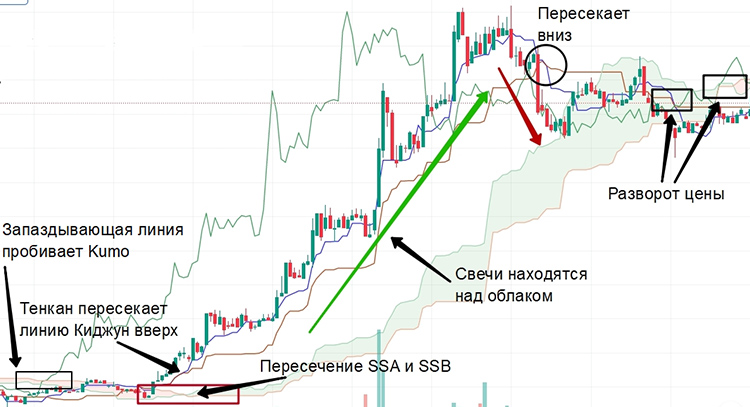
The Tenken and Kijun cross reports an upward movement. But the most reliable sign is the breakdown of Kumo by the lagging line and the crossing of Senkou Span A and Senkou Span B. The shape of the cloud also indicates the trend: the wider it is, the more buyers’ interest.
Beginners are recommended to practice using the indicator on a demo account. This will help to define a strategy or develop your own.
Stop-loss and exit from trades according to the indicator
Before opening a position, traders determine the acceptable risk. To do this, they set stop losses. With their help, you can exit the trade and prevent losses caused by unpredictable changes in the trend. The chart of BTC/USD according to the Ishimoku cloud indicator shows where to place an order. For Long positions, the following rules apply:
- Sell is set a few pips below the Kijun band. When the cost along with the element starts moving up, the stop loss is moved higher.
- Traders are also oriented on Senkou Span A (the top of the green Kumo). The order at the moment of position opening is at the bottom of the line. Then it moves closer to the current price.
The same principle is used for short trades. Some market participants prefer to trade without stops. In this case, they are oriented on the crossing of elements. There are two types of manual exits:
- Conservative. The trade is stopped out when Kijun and Tenkan create a cross.
- Aggressive. The position is closed after the price breaks through Kumo.
Comparison of the Ishimoku Cloud with Moving Averages
Despite the fact that both systems belong to oscillators, there are differences between them. For example, the 15-period moving average summarizes the closing prices for 15 days, then divides by 15 to get the average. The Ishimoku, on the other hand, is based on extremes over a set period of time and is calculated by dividing by 2. The results will differ even if the same number of periods are used.
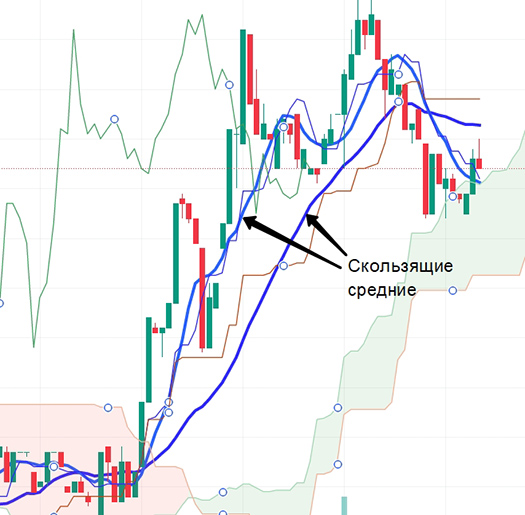
Since Tenkan-sen has a limited period, it is responsible for the short-term trend, while Kijun-sen is responsible for the medium-term trend. Their combination gives practically the same signals as the sliding ones. On the chart, they are almost identical to the cloud elements. However, the Ishimoku bands behave more dynamically and show volatility in more detail. A number of similarities and differences can be distinguished.
Trading Strategies
There are many ways to use in trading. Market participants pay attention to the following indicators:
- Candlesticks. If the price is located above Kumo, a long position is opened. When it descends, the asset is put up for sale.
- Kumo breakthrough. The signal to buy is the breakthrough of candlesticks upwards. A short trade makes sense if they go beyond the cloud downward.
- Tenkan and Kijun. If the blue line crosses the red one from bottom to top, it is an indicator of a bullish trend. If the opposite is true, it is a bearish trend.
- Cloud. When Senkou Span A forms a cross from the bottom to the top, traders enter longing. A short is opened if Senkou Span B dominates.
It is worth noting separately the “Edge to Edge” trade. This strategy is used when price action moves from one side of the cloud to the other. It is used in both bullish and bearish scenarios.
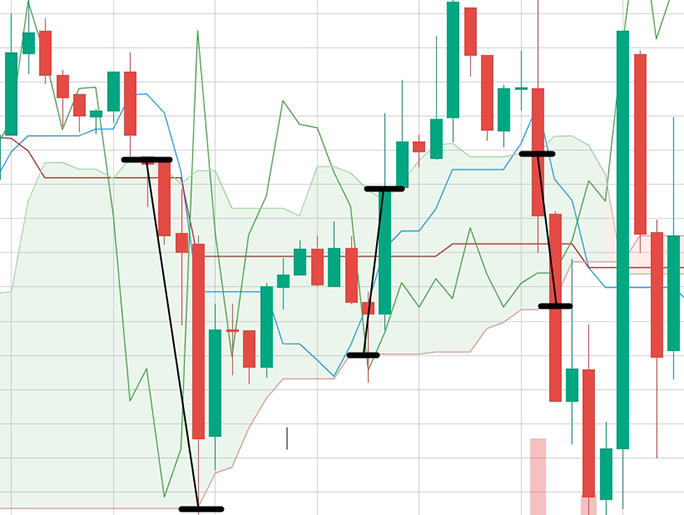
How to trade the Ishimoku cloud?
Before starting to buy or sell using this system, traders evaluate all its components. Signals are divided into strong or weak according to their connection with Kumo. More details – in the table.
| Element | Strong Buy signal | Strong impulse to sell | Weak signal |
|---|---|---|---|
| Kijun and Tenkan cross | Above | Below | Inside |
| Chikou span on Kumo breakout | Goes beyond up | Breaks beyond edges down | Does not move |
| Cloud reversal | Senkou Span A goes from below to above and prices are above Kumo | From top to bottom, candles are lower | Prices are in opposite sides of the trend |
For more reliable trades, market participants combine all the tools of the system. The trading algorithm is as follows:
- Searching for a pre-sign. The price enters Kumo, stays in it for some time.
- Detection of the main signal. The candle comes from the cloud and heads in its direction. The second condition is the crossing of the Tenkan-sen and Kijun-sen lines.
- Selection of confirmation signs. Here one looks at the Chikou Span. If the strip is located near the cross of Kijun and Tenkan – this is the basis for opening a position.
Conclusions
The Ishimoku cloud indicator is a universal trading system that allows traders to get the necessary information about the balance of the market. The complexity is compensated for by the fact that the tool provides a complete visual picture of potential price movements. It can be used in combination with other technical indicators to determine the best entry and exit points.
Frequently Asked Questions
💡 Are all lines necessarily used in trading?
No. It depends on the experience and personal strategies of the trader. Some exclude the Chikou Span, considering the element not informative enough.
😎 What tools can be combined with Ishimoku?
It is complemented by standard oscillators such as RSI, CCI, MACD.
❔ How accurate are the signals provided by the tool?
The indicators are based on historical data. Trends may not be repeated in the future. You need to focus on all components of the system and follow risk management.
👀 Can such an indicator be used by beginners?
It refers to complex types. It is recommended to master simpler variants first.
💻 Which exchange is more suitable for trading with Ishimoku?
The indicator is universal. You can choose a crypto platform on monitoring sites.
Error in the text? Highlight it with your mouse and press Ctrl + Enter
Author: Saifedean Ammous, an expert in cryptocurrency economics.


